The short answer
Small business websites are common but neglected. Of 367,330 US businesses in our lists, 18.8% have no website. Of 223,784 sites we crawled, 70.7% run no analytics or ad tracking, 6.9% still carry retired Universal Analytics code, 24.6% lack a meta description, and 28.9% of WordPress sites that show a version run something older than 6.0. Only 15.9% of listings link online booking.
We build lead lists of US small and local businesses for a living, which means we look at a lot of small business websites. In November 2026 we turned that into a census. We took every business in our 435 ready-made lists, read its map listing, crawled its website and checked its contacts. This report pulls the findings of our 19 other insight studies into one place, with the numbers agencies, SaaS sellers and local marketers ask us about most.
How the report was built
From listing to report
- 1367,330 listings435 lists, 71 industries with 1,000+ listings
- 2Website on the listing81.2% link one
- 3223,784 sites crawledhome page HTML read
- 4Contacts found285,744 businesses in 323 finished lists
- 520 studiesbuilders, tracking, SEO, listings, hours, reviews, owners
1. Who has a website
81.2% of listings link a website, so 18.8% of small and local businesses have none we can find. That gap is far from even. Anesthesiologists (54.2%) and pathologists (52.4%) lead, because many work inside hospitals and never needed their own site. Among businesses that choose their own marketing, auto repair shops (45.3%), butcher shops (42.9%) and beauty salons (38.0%) are the least likely to have a website, followed by oil and gas companies (36.4%), travel agencies (30.1%), cleaning companies (30.0%) and bars (29.9%). Plastic surgeons (4.5%), golf courses (3.9%) and banks (5.5%) almost all have one. The full picture is in small businesses without a website.
Businesses with no website on their listing
2. What the sites are built on
Half of the sites we crawled (50.7%) name their builder in the HTML. Among those, WordPress runs 70.5%, Wix 11.7%, GoDaddy's builder 5.2%, and Drupal, HubSpot, Webflow, Gatsby and Joomla sit near 1% each. Wix is strongest where owners build their own site: record labels (37.2% of declared builders), beauty salons (29.5%), event companies (28.2%), churches (26.6%) and interior designers (24.9%). Squarespace and Shopify do not print a generator tag, so a study like this one cannot count them. Details: small business website builders.
Builder share among sites that declare one
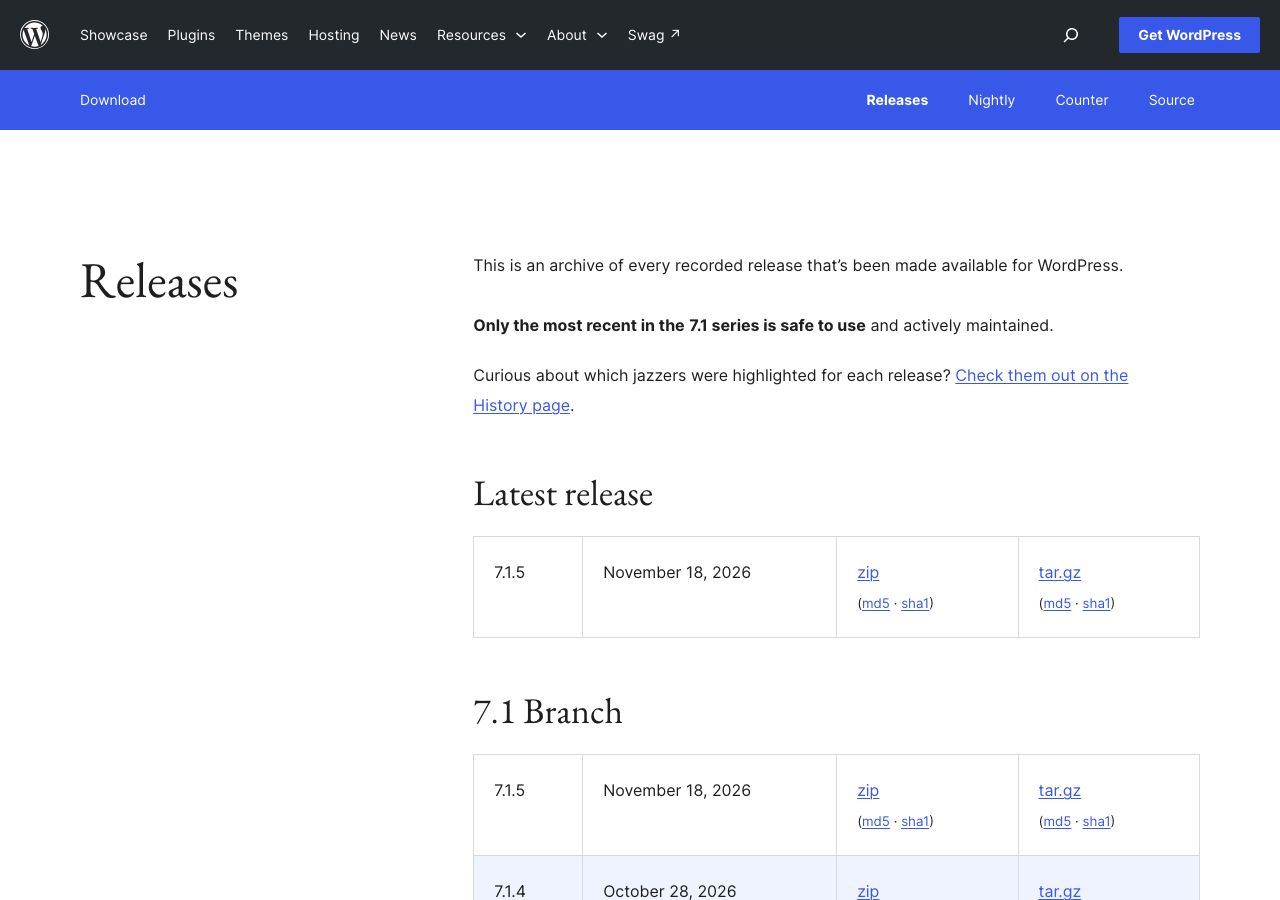
WordPress sites age badly when nobody looks after them. 37,613 WordPress sites print their version number. 28.9% run a version older than 6.0 and 42.4% run something older than 6.5. Among industries with 300 or more versioned sites, architects (55.1%), churches (54.3%) and mortgage brokers (46.4%) have the most below 6.0. WordPress itself says only the newest release in the current branch is safe to use and actively maintained; at the time of this report that branch is 7.1. More in outdated WordPress on small business websites.
3. Analytics and tracking
Most small business owners have no idea how many people visit their website, because nothing is counting. 70.7% of crawled sites run no Google Analytics, no Google tag and no Meta pixel. 26.9% carry a Google ID of some kind (Analytics, Ads or the Google tag), 15.7% a current GA4 ID and 16.8% the Google tag. Only 3.2% run a Meta (Facebook) pixel, so very few small businesses can retarget their visitors. Plastic surgeons are the best measured (45.8% with no tracking); pharmacies (88.5%), podiatrists (87.5%) and churches (87.2%) the least.
Tracking on crawled small business websites
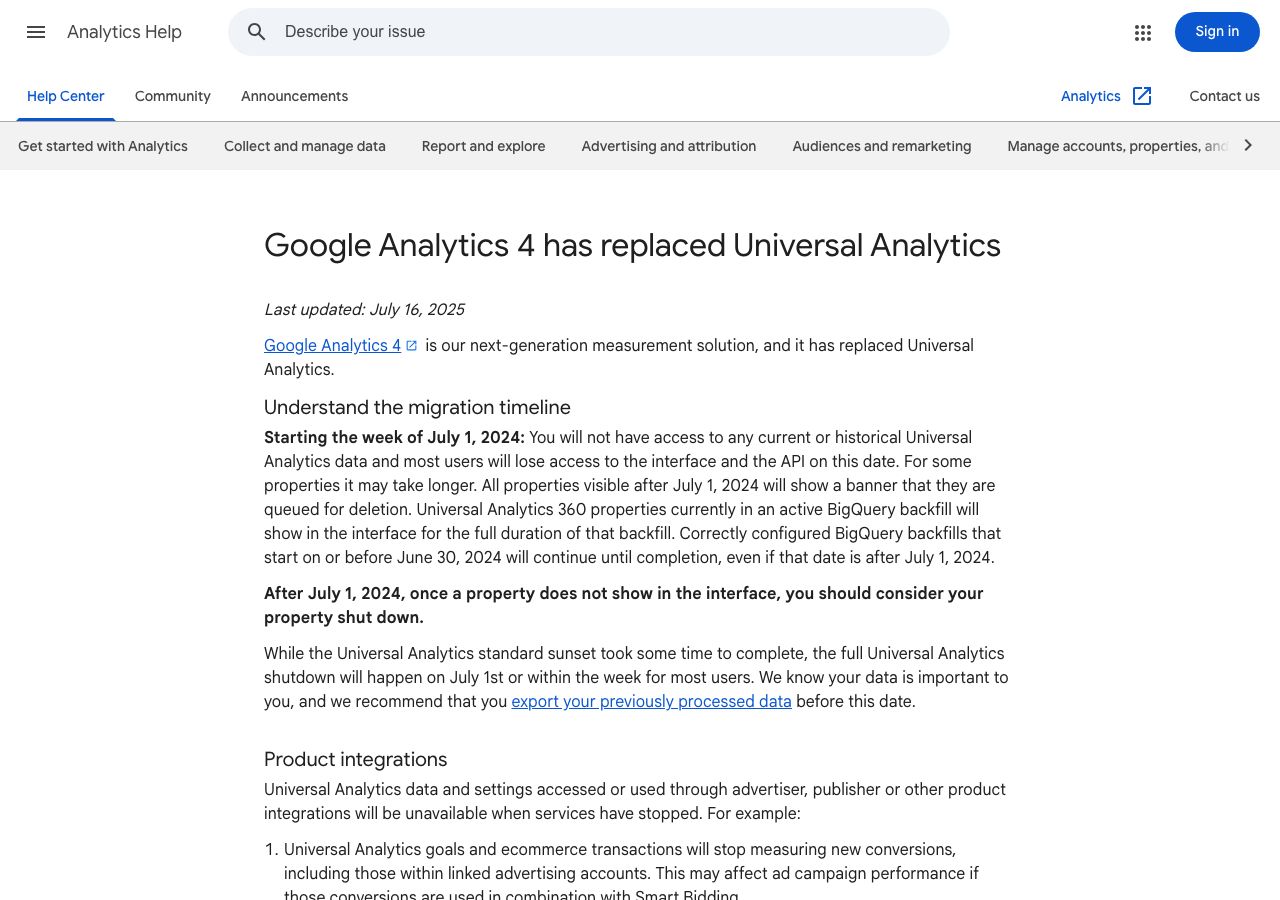
Then there is the dead code. 6.9% of crawled sites still carry a Universal Analytics ID, the UA- tags Google retired. Google's help page says that starting the week of July 1, 2024, no one has access to Universal Analytics data, so those tags collect nothing anyone can see. Hotels (13.2%), insurance companies (13.0%), urologists and colleges (12.6% each) and dentists (12.2%) carry the most. Studies: Universal Analytics still installed and small business website tracking.
4. Search basics
The basics are mostly there, but a quarter of sites skip the one tag that writes their search snippet. 94.9% of crawled sites have a title tag and only 3.6% have a weak one such as "Home" or "Welcome". 24.6% have no meta description, so search engines write the snippet for them. Churches (47.8% with a description), newspapers (49.9%), business associations (51.6%) and oil and gas companies (51.9%) are furthest behind; medical practices are furthest ahead. 28.1% still carry a meta keywords tag, which search engines have ignored for years. See small business website SEO basics.
Crawled sites with each SEO basic
5. Listings: claimed, complete, bookable
The map listing is often a small business's real home page, and a quarter are left untended. 24.3% of listings are unclaimed. Anesthesiologists (76.2%), pathologists (69.1%), oil and gas companies (60.7%), churches (54.7%) and newspapers (53.1%) have the most unclaimed listings. Only 6.1% of listings carry an owner-written description. The median listing has 6 photos; 41.9% have 10 or more and 2.9% have none. Studies: unclaimed business listings, business listing completeness and business listing photos and logos.
Online booking is still the exception. 15.9% of listings link a booking or appointment page and 15.8% an online ordering link. Golf courses (47.7%), personal care studios (47.5%), podiatrists (44.3%), allergists (41.4%), plastic surgeons and dermatologists (40.3% each) lead on booking; beauty salons (38.2%) and dentists (36.1%) are close behind. For restaurants the ordering and reservation story is in restaurant online ordering and reservations, and booking by trade is in online booking by industry.
Listing completeness
Has itMissing
The listing also carries what the business says about itself. 45.7% of listings with hours open on Saturday and 33.4% on Sunday (opening hours by industry). 76.1% list a wheelchair accessible entrance (wheelchair accessible businesses), but only 8.0% state how they take payment (payment methods). A small share carry owner attributes such as women-owned, Latino, veteran, Black or Asian-owned (women-owned small businesses, minority and veteran-owned businesses).
Reviews are part of the picture too. 58.2% of rated listings carry at least one 1-star review, and 1-star reviews are 6.5% of 63.5 million reviews (one-star reviews by industry). The median business in our finished lists has 16 reviews and a 4.51 average rating (review counts by industry).
6. Reaching the owner
A website is also where most small businesses publish their email. In our 323 finished lists, 73.5% of 285,744 businesses have at least one verified email, 95.4% a phone number and 63.0% at least one social profile. Among businesses with a website, 90.9% have an email. Our email search reads the business's own site, so a business without one is reached by phone. 74.3% of businesses with an email use an address on their own domain, 15.5% a free mailbox (65.2% of those are Gmail), and 19.6% lead with a generic inbox such as info@. More in small business email domains and which industries publish email addresses.
Businesses with a verified email, by review count
Email rates swing by industry. Banks (93.1%), plastic surgeons (90.1%), financial advisors (89.6%), mortgage brokers (86.9%) and law firms (86.0%) publish the most. Butcher shops (41.9%), auto repair shops (42.0%), anesthesiologists (43.6%), beauty salons (46.2%) and bars (49.2%) publish the least; restaurants sit at 57.8%. These are phone-first businesses. The guide more reviews, more emails explains the review-count effect, and cold calling small businesses covers the phone-first ones.
What this means for agencies and sellers
Put the findings together and the small business web looks like this: four in five businesses have a site, WordPress runs most of the sites that name their builder, seven in ten sites measure nothing, a large minority run old software, and a quarter of listings have no owner looking after them. Each gap is a sales conversation, and each one can be found from outside the business before the first call.
- 01
Web design and rebuilds
Start with the 18.8% with no website, heaviest in auto repair, butcher shops, salons and bars. Then the WordPress sites below 6.0, the first to break and the easiest to show.
- 02
Care plans and security
28.9% of versioned WordPress sites predate 6.0 and 42.4% predate 6.5. Churches, architects and mortgage brokers top the list. A version number in the source code is a fact you can quote.
- 03
Analytics and ads
70.7% of sites track nothing and 6.9% still run dead Universal Analytics code. "Your analytics tag stopped working in 2024" is an opener the owner can check in a minute.
- 04
SEO and local listings
24.6% of sites lack a meta description and 24.3% of listings are unclaimed. Churches, newspapers and oil and gas firms trail on both.
- 05
Booking and payments
Only 15.9% of listings link booking, even in appointment trades. Salons, clinics and trades without a booking link are the obvious buyers for scheduling software.
- 06
Reach the owner
73.5% of businesses in our finished lists have a verified email and 95.4% a phone. Start from a ready-made list at $29, or a Bespoke plan that builds to your brief.
Full table: the small business web by industry
Industries with at least 1,000 listings. "No website", "Booking" and "Unclaimed" are shares of listings (367,330 base). "No tracking" and "UA code" are shares of crawled sites and "WordPress" is its share of the crawled sites that name a builder, all shown where we crawled 300 or more; "WP below 6.0" is shown where 100 or more WordPress sites print a version. "Email" is the share with a verified email in our finished lists (285,744 base), shown where we have 300 or more businesses.
| Industry | Listings | No website | Sites crawled | WordPress (of named builders) | WP below 6.0 | No tracking | UA code | Booking | Unclaimed | |
|---|---|---|---|---|---|---|---|---|---|---|
| Churches | 26,901 | 26.7% | 17,664 | 55.4% | 54.3% | 87.2% | 3.7% | 0.0% | 54.7% | 66.9% |
| Real estate agents | 25,587 | 14.3% | 17,873 | 72.2% | 41.5% | 69.5% | 5.7% | 10.5% | 10.0% | 77.6% |
| Restaurants | 15,755 | 19.8% | 8,166 | 56.4% | 27.6% | 67.9% | 5.1% | 20.9% | 12.5% | 57.8% |
| Accountants | 16,191 | 28.5% | 10,086 | 65.9% | 31.7% | 77.2% | 7.4% | 8.2% | 35.4% | 64.8% |
| Dentists | 14,372 | 16.6% | 9,560 | 82.7% | 19.0% | 56.5% | 12.2% | 36.1% | 21.7% | 78.7% |
| Advertising agencies | 12,422 | 10.9% | 10,215 | 78.2% | 30.8% | 61.9% | 7.7% | 19.2% | 12.5% | 83.3% |
| Hotels | 12,276 | 11.8% | 9,964 | 80.8% | 6.4% | 71.8% | 13.2% | 0.0% | 9.3% | 84.1% |
| Pharmacies | 11,554 | 17.3% | 7,855 | 80.3% | 18.9% | 88.5% | 1.3% | 14.4% | 12.7% | 72.3% |
| Car dealerships | 11,122 | 22.1% | 6,544 | 75.3% | 39.2% | 73.9% | 3.2% | 8.7% | 20.0% | 62.3% |
| Nursing homes | 9,351 | 13.8% | 6,288 | 82.6% | 20.0% | 55.5% | 9.4% | 16.2% | 16.2% | 79.5% |
| Financial advisors | 7,864 | 8.3% | 5,402 | 47.9% | 28.1% | 61.3% | 5.4% | 29.3% | 14.5% | 89.6% |
| Architects | 7,719 | 12.2% | 5,805 | 62.7% | 55.1% | 81.5% | 5.5% | 3.3% | 29.6% | 82.9% |
| Mortgage brokers | 7,477 | 8.6% | 5,470 | 71.1% | 46.4% | 69.0% | 7.0% | 13.7% | 8.3% | 86.9% |
| Bars | 6,978 | 29.9% | 2,615 | 58.3% | 18.7% | 68.6% | 5.4% | 12.4% | 20.3% | 49.2% |
| Pediatricians | 6,878 | 24.6% | 3,916 | 74.3% | 19.0% | 65.3% | 10.8% | 23.5% | 37.8% | 69.8% |
| Family physicians | 6,809 | 19.9% | 3,381 | 83.4% | 21.4% | 78.2% | 4.6% | 29.1% | 30.7% | 74.5% |
| Chiropractors | 6,301 | 21.4% | 1,418 | 65.5% | 17.1% | 57.1% | 7.5% | 30.2% | 23.1% | 83.4% |
| Commercial contractors | 6,202 | 20.6% | 2,156 | 64.7% | 22.5% | 67.5% | 6.4% | 8.2% | 19.9% | 72.7% |
| Printing companies | 5,979 | 15.9% | 2,740 | 66.0% | 27.6% | 71.9% | 5.6% | 6.3% | 14.4% | 77.5% |
| Travel agencies | 5,561 | 30.1% | 3,079 | 64.8% | 45.0% | 75.3% | 5.5% | 12.0% | 25.7% | 63.7% |
| Urologists | 5,431 | 13.0% | 4,291 | 87.4% | 10.5% | 62.1% | 12.6% | 25.8% | 22.9% | 81.8% |
| Hospitals | 5,171 | 17.8% | 3,667 | 77.9% | 9.7% | 72.0% | 7.6% | 4.6% | 30.6% | 80.5% |
| Banks | 4,697 | 5.5% | 3,032 | 61.7% | 62.5% | 79.9% | 6.3% | 33.9% | 13.3% | 93.1% |
| Surgeons | 4,557 | 15.8% | 3,248 | 81.2% | 24.6% | 74.3% | 6.6% | 23.0% | 24.3% | 78.3% |
| Colleges | 4,516 | 11.8% | 3,337 | 68.7% | 31.4% | 59.7% | 12.6% | 4.3% | 42.5% | 84.4% |
| Insurance companies | 4,483 | 16.4% | 2,820 | 70.6% | 17.9% | 61.4% | 13.0% | 13.1% | 13.6% | 76.6% |
| Beauty salons | 4,244 | 38.0% | 1,787 | 46.5% | 18.3% | 78.6% | 2.6% | 38.2% | 17.7% | 46.2% |
| Radiologists | 4,051 | 24.4% | 2,706 | 70.7% | 23.8% | 77.0% | 7.2% | 16.4% | 38.4% | 69.9% |
| Anesthesiologists | 3,998 | 54.2% | 1,435 | 80.7% | 22.2% | 71.1% | 4.7% | 7.8% | 76.2% | 43.6% |
| ENT doctors | 3,906 | 9.5% | 1,433 | 77.5% | 11.5% | 66.7% | 5.0% | 31.1% | 20.0% | - |
| Plastic surgeons | 3,829 | 4.5% | 3,553 | 83.3% | 15.5% | 45.8% | 12.1% | 40.3% | 9.8% | 90.1% |
| Therapists | 3,608 | 10.8% | 27 | - | - | - | - | 24.8% | 15.6% | - |
| Cardiologists | 3,523 | 14.7% | 2,545 | 69.5% | 22.7% | 72.6% | 6.9% | 30.6% | 23.6% | 79.8% |
| Gyms | 3,415 | 12.9% | 1,889 | 50.3% | 20.8% | 66.5% | 6.2% | 29.2% | 10.8% | 79.4% |
| Oncologists | 3,367 | 11.1% | 2,361 | 83.7% | 12.3% | 72.1% | 4.6% | 26.9% | 19.5% | 84.6% |
| Oil and gas companies | 3,180 | 36.4% | 1,665 | 67.2% | 45.0% | 80.1% | 5.5% | 0.2% | 60.7% | 60.3% |
| Event companies | 3,089 | 18.6% | 2,164 | 54.5% | 41.4% | 75.6% | 4.7% | 11.5% | 18.5% | 74.9% |
| Endocrinologists | 3,080 | 10.2% | 2,313 | 70.6% | 21.9% | 76.7% | 4.6% | 24.8% | 20.2% | 85.1% |
| Physician offices | 2,569 | 21.3% | 966 | 82.2% | 7.4% | 60.0% | 3.8% | 23.4% | 33.4% | 87.5% |
| Neurologists | 2,494 | 21.3% | 1,564 | 75.3% | 20.9% | 74.2% | 3.3% | 21.8% | 31.2% | 73.4% |
| HVAC and plumbers | 2,478 | 22.6% | 1,811 | 72.2% | 11.7% | 58.0% | 7.5% | 31.1% | 9.9% | 68.1% |
| Publishers | 2,471 | 23.6% | 1,727 | 67.1% | 33.2% | 69.3% | 5.4% | 2.8% | 41.2% | 68.8% |
| Ophthalmologists | 2,316 | 10.3% | 1,246 | 68.1% | 13.9% | 65.2% | 7.5% | 36.4% | 18.9% | 81.3% |
| Landscapers | 2,281 | 25.3% | 1,611 | 62.6% | 23.2% | 66.8% | 5.2% | 15.2% | 12.5% | 67.0% |
| Orthopedic surgeons | 2,220 | 12.3% | 1,310 | 84.4% | 20.1% | 62.7% | 6.3% | 36.1% | 19.9% | 77.6% |
| Newspapers | 2,192 | 22.0% | 1,566 | 77.9% | 39.5% | 73.9% | 8.4% | 1.6% | 53.1% | 75.1% |
| Law firms | 2,172 | 9.0% | 1,963 | 77.3% | 27.3% | 63.7% | 7.9% | 17.9% | 13.6% | 86.0% |
| Butcher shops | 2,130 | 42.9% | 818 | 57.5% | 26.9% | 76.8% | 5.7% | 1.4% | 31.7% | 41.9% |
| Roofers | 2,116 | 13.9% | 1,735 | 78.3% | 11.3% | 58.7% | 6.9% | 18.4% | 11.1% | 71.9% |
| Auto repair shops | 2,083 | 45.3% | 971 | 62.5% | 14.1% | 66.0% | 6.3% | 17.9% | 15.4% | 42.0% |
| Medical device makers | 1,976 | 23.7% | 1,240 | 69.0% | 32.4% | 73.9% | 5.9% | 0.9% | 36.3% | 69.4% |
| Dermatologists | 1,960 | 11.4% | 1,654 | 77.6% | 14.4% | 57.0% | 7.6% | 40.3% | 18.9% | 82.3% |
| Museums | 1,929 | 5.9% | 1,382 | 61.6% | 49.0% | 77.9% | 7.4% | 2.2% | 28.7% | 89.2% |
| Bed and breakfasts | 1,883 | 8.1% | 33 | - | - | - | - | 0.0% | 13.3% | - |
| Podiatrists | 1,883 | 16.6% | 416 | 92.5% | - | 87.5% | 1.7% | 44.3% | 22.9% | - |
| Home builders | 1,863 | 13.6% | 1,551 | 64.5% | 10.4% | 64.6% | 8.7% | 11.1% | 12.7% | 81.9% |
| Interior designers | 1,807 | 12.3% | 752 | 61.2% | 19.0% | 65.6% | 8.8% | 11.0% | 14.4% | 85.0% |
| Aerospace manufacturers | 1,802 | 13.4% | 6 | - | - | - | - | 0.1% | 45.2% | - |
| Stockbrokers | 1,792 | 14.1% | 994 | 56.0% | 32.8% | 65.0% | 7.0% | 15.0% | 26.6% | 82.6% |
| Cleaning companies | 1,715 | 30.0% | 1,088 | 66.8% | 10.2% | 61.5% | 6.5% | 23.6% | 10.8% | 57.3% |
| Electricians | 1,668 | 26.7% | 1,122 | 58.3% | 17.7% | 75.0% | 3.8% | 14.6% | 26.2% | 60.1% |
| Record labels | 1,542 | 20.9% | 866 | 46.4% | 54.9% | 82.0% | 5.3% | 24.2% | 14.9% | 66.9% |
| Pathologists | 1,496 | 52.4% | 530 | 65.9% | - | 76.2% | 2.8% | 11.0% | 69.1% | 45.6% |
| Allergists | 1,436 | 7.0% | 1,277 | 74.6% | 12.8% | 55.5% | 11.8% | 41.4% | 16.7% | 86.7% |
| Wineries | 1,368 | 8.9% | 1,237 | 70.0% | 52.8% | 79.1% | 6.8% | 31.9% | 19.5% | 89.0% |
| Biotech companies | 1,269 | 12.1% | 1,015 | 70.8% | 42.5% | 77.9% | 5.4% | 0.5% | 37.3% | 77.7% |
| Business associations | 1,236 | 9.3% | 690 | 80.9% | 35.0% | 68.1% | 10.7% | 2.0% | 28.3% | 90.3% |
| Personal care studios | 1,197 | 15.9% | 69 | - | - | - | - | 47.5% | 5.9% | - |
| Golf courses | 1,153 | 3.9% | 44 | - | - | - | - | 47.7% | 21.8% | - |
| Veterinarians | 1,145 | 11.2% | 9 | - | - | - | - | 28.6% | 22.3% | - |
| Private equity firms | 1,126 | 9.8% | 930 | 68.4% | 59.0% | 80.2% | 4.4% | 3.0% | 31.6% | 86.7% |
| All industries | 367,330 | 18.8% | 223,784 | 70.5% | 28.9% | 70.7% | 6.9% | 15.9% | 24.3% | 73.5% |
Every study in this report
- Websites: website builders, outdated WordPress, Universal Analytics still installed, website tracking, businesses without a website, website SEO basics, email domains
- Listings: online booking by industry, unclaimed listings, listing photos and logos, listing completeness, restaurant ordering and reservations
- Owners and attributes: women-owned businesses, minority and veteran-owned businesses, wheelchair accessible businesses, payment methods
- Hours and reviews: opening hours, one-star reviews, review counts
- Guides that use this data: how to build a local business lead list, cold calling small businesses, more reviews, more emails, which industries publish email addresses