The short answer
Most don't. 70.7% of the 223,784 small business websites we crawled show no Google Analytics ID, no Google tag and no Meta (Facebook) pixel in their HTML. 15.7% carry a GA4 ID, 16.8% load the Google tag and 3.2% have the Meta pixel. Only 2.0% run both the pixel and the Google tag, the clearest sign a business pays for ads.
If you sell ads management, analytics setup, call tracking or a marketing SaaS tool, the tracking on a prospect's website tells you two things. Whether they measure anything at all, and whether they are already spending on ads. We read both from every site in our ready-made lists. The short version: most small businesses measure nothing, and the few that advertise are easy to spot.
How we measured it
We crawled 223,784 business websites in November 2026 and read each home page's HTML. For each one we record one Google ID (G- for GA4, UA- for the retired Universal Analytics, AW- for Google Ads, GT- for the Google tag), whether the Google tag is present, and whether the Meta pixel is present. Counts are per listing; the 223,784 listings sit on 147,526 separate domains. A site counts as "no tracking detected" when none of the three appear.
What we look for on each home page
- 1Google Analytics IDG- (GA4) or UA- (retired)
- 2Google tagused by GA4 and Google Ads
- 3Meta pixelused for Facebook and Instagram ads
- 4None of the threecounted as no tracking detected
This is a reading of page HTML, so it has blind spots. Tags fired only through a tag manager container, or added by a hosted builder's own scripts after the page loads, can be missed. That matters most for Wix, which shows 92.9% no tracking detected, likely more than is really there. Treat every "no tracking" figure on this page as an upper bound and every adoption figure as a floor.
The overall picture
Tracking found on small business websites
Counting each website domain once instead of each listing gives almost the same answer: 71.5% no tracking, 3.2% with the pixel. The 6.9% still carrying a Universal Analytics code is a story of its own, since Google stopped processing that data on July 1, 2023. See Universal Analytics still installed.
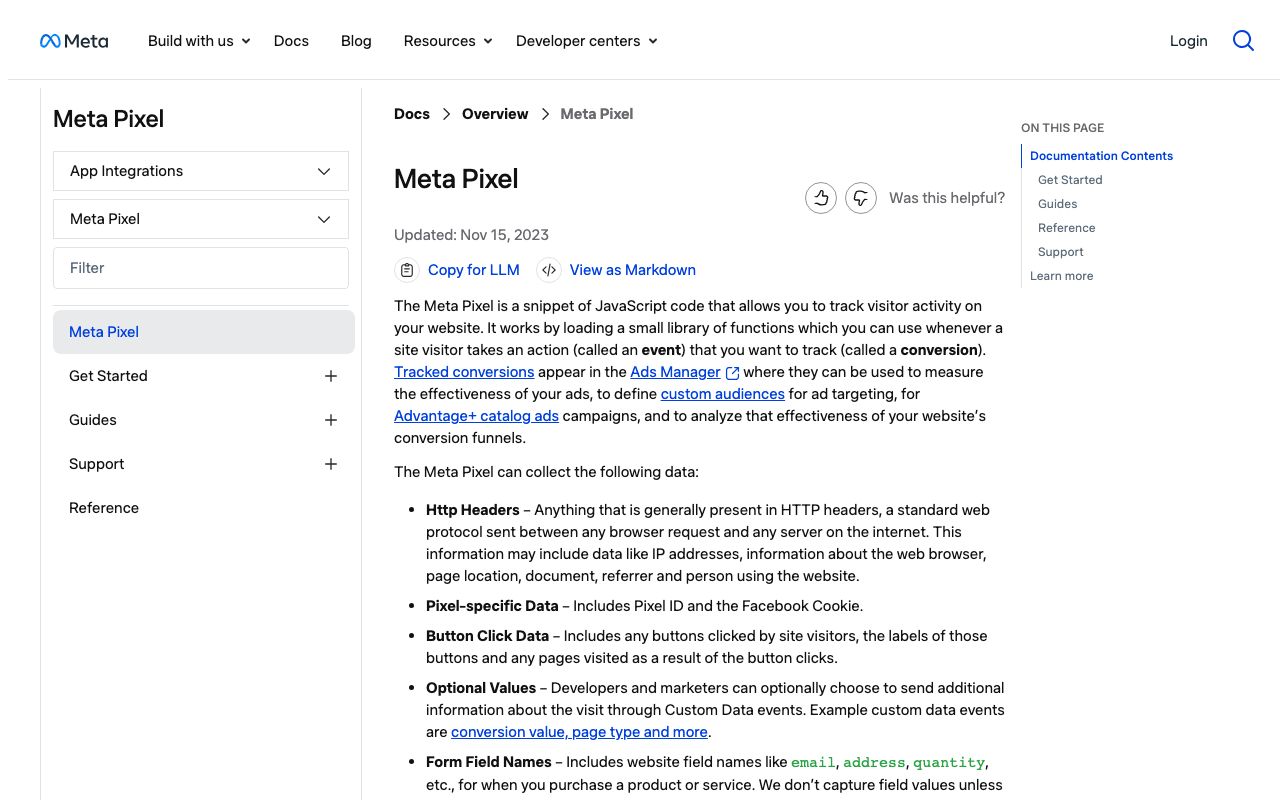
The Meta pixel is the rarest tag and the most telling one. Meta's own docs describe it as a "snippet of JavaScript code that allows you to track visitor activity" for measuring ads and building audiences. Nobody installs it by accident. A business with the pixel has run, or planned to run, Facebook or Instagram ads.
Which industries look like they advertise
We use the pixel plus the Google tag together as the clearest ad signal: one for social ads, one for Google Ads and GA4. Colleges lead by a wide margin (9.5% have both, 14.1% have the pixel), which fits schools that recruit students online. Then come physician offices (6.9% both), home builders (5.0%), plastic surgeons (4.1%), advertising agencies and mortgage brokers (4.0% each), urologists (3.7%), real estate agents and cleaning companies (3.4% each).
Meta pixel vs Google tag, selected industries
Meta pixelGoogle tag
Oncologists show a high pixel rate (9.9%) but almost no overlap with the Google tag (0.4%). That pattern usually means one large network's pages repeated across many listings, not hundreds of independent practices buying ads. Check domains before you treat it as a trend.
Medical and home-service trades measure the most. Plastic surgeons have the lowest no-tracking rate in the data (45.8%), followed by nursing homes and allergists (55.5% each), dentists (56.5%), dermatologists (57.0%), chiropractors (57.1%), HVAC and plumbing (58.0%) and roofers (58.7%). These trades buy leads, and leads need tracking. The least measured are pharmacies (88.5% no tracking, mostly chain pages), churches (87.2%), record labels (82.0%), architects (81.5%) and private equity firms (80.2%).
Trades that measure but skip social ads
Some industries install Google tracking at a healthy rate and almost never add the Meta pixel. Financial advisors are the clearest case: 29.7% carry a GA4 ID and 32.7% load the Google tag, but only 1.8% have the pixel. Advisor marketing runs through compliance review, and social ad targeting is harder to clear. Stockbrokers look the same (28.5% Google tag, 2.3% pixel).
Dentists (25.4% Google tag, 3.7% pixel), chiropractors (29.5% and 3.7%), law firms (23.5% and 3.5%) and restaurants (21.2% and 2.6%) follow a softer version of the pattern. They measure their site and probably buy Google Ads or search help, but most have not tried paid social. For an agency that runs Meta campaigns, a business that already pays for Google is the warmest prospect there is: it has a budget and a habit of testing channels.
Hotels are the odd one out. Only 7.2% of hotel listings carry a GA4 ID while 13.2% still carry the retired Universal Analytics code, mostly on one franchise chain's pages. Independent hotels and inns tend to lean on booking platforms for their traffic, which may explain why so few track their own site.
Builder, size and state
The website platform shapes what we can see. HubSpot sites are the most instrumented (42.6% no tracking, 44.4% with a GA4 ID, 9.0% with the pixel), then Webflow (50.6% none) and WordPress (56.6%). GoDaddy's builder sits at 77.4% and Wix at 92.9%, with the caveat above about hosted builders. Builder shares are on which website builders small businesses use.
No tracking detected, by number of reviews on the listing
Busier businesses measure more, but not by much: 63.6% of businesses with 200 or more reviews still show no tracking. The pixel rate rises from 1.8% to 4.3% across the same bands. By state, Oregon (66.7% none), New York (67.1%), Ohio (67.5%) and Texas (67.8%) track the most; Washington (81.7%), Michigan (81.3%) and Massachusetts (80.8%) the least, among states with 1,500 or more crawled sites.
Who to sell to, and what to say
- 01
No tracking at all: sell measurement
Seven in ten sites. Pitch GA4 and call tracking first, before ads. "You can't tell which calls came from the website" is a problem every owner understands.
- 02
Google tag but no pixel: sell social ads
They already pay for Google. A Meta campaign is the natural next test, and you know they buy marketing.
- 03
Pixel and Google tag: sell results
Only 2.0% of sites. They have an ad budget today, so pitch lower cost per lead, landing pages or reporting.
- 04
Old UA- code only: sell the fix
Dead tracking since 2023. The most concrete opener of the four.
Size the market before you pick a lane. Across our 223,784 crawled sites, 158,263 listings show no tracking, 37,604 load the Google tag and 7,247 have the Meta pixel. Only 4,457 have both. A pitch for advertisers is a small, high-value list; a pitch for measurement has a very long tail of small owners who have never seen their own traffic numbers.
Pair the tracking signal with the basics on the page: a weak title or missing meta description, an outdated WordPress install, or a listing with no online booking. For wording, see how to cold email local businesses.
A Bespoke plan builds lists to these signals: roofers with the Google tag and no pixel, or dentists with no tracking at all, by state or metro. Starter is $99 a month for 2,000 verified leads, Pro $199 for 5,000. Ready-made lists by trade and area are $29 once.
Full table: tracking by industry
Shares of crawled sites in each industry, per listing. Industries with fewer than 400 crawled sites are left out. Sorted from most tracked to least. The overview of every website signal is in the state of small business websites 2026.
| Industry | Sites crawled | GA4 (G-) | Google tag | Meta pixel | No tracking |
|---|---|---|---|---|---|
| Plastic surgeons | 3,553 | 28.4% | 20.7% | 6.5% | 45.8% |
| Nursing homes | 6,288 | 26.6% | 27.0% | 4.6% | 55.5% |
| Allergists | 1,277 | 22.8% | 23.0% | 3.4% | 55.5% |
| Dentists | 9,560 | 23.5% | 25.4% | 3.7% | 56.5% |
| Dermatologists | 1,654 | 25.3% | 23.5% | 3.0% | 57.0% |
| Chiropractors | 1,418 | 25.5% | 29.5% | 3.7% | 57.1% |
| HVAC and plumbing | 1,811 | 23.1% | 19.5% | 3.3% | 58.0% |
| Roofers | 1,735 | 20.9% | 21.7% | 4.1% | 58.7% |
| Colleges | 3,337 | 18.0% | 26.5% | 14.1% | 59.7% |
| Physician offices | 966 | 20.5% | 23.8% | 8.8% | 60.0% |
| Financial advisors | 5,402 | 29.7% | 32.7% | 1.8% | 61.3% |
| Insurance companies | 2,820 | 17.2% | 22.4% | 3.3% | 61.4% |
| Cleaning companies | 1,088 | 15.5% | 19.5% | 4.5% | 61.5% |
| Advertising agencies | 10,215 | 19.5% | 21.3% | 5.8% | 61.9% |
| Urologists | 4,291 | 18.9% | 18.4% | 5.2% | 62.1% |
| Orthopedic surgeons | 1,310 | 25.0% | 17.6% | 1.3% | 62.7% |
| Law firms | 1,963 | 18.7% | 23.5% | 3.5% | 63.7% |
| Home builders | 1,551 | 19.3% | 17.8% | 6.6% | 64.6% |
| Stockbrokers | 994 | 23.8% | 28.5% | 2.3% | 65.0% |
| Ophthalmologists | 1,246 | 18.1% | 19.2% | 3.0% | 65.2% |
| Pediatricians | 3,916 | 17.2% | 16.7% | 4.4% | 65.3% |
| Interior designers | 752 | 18.0% | 22.1% | 2.8% | 65.6% |
| Auto repair shops | 971 | 16.4% | 19.9% | 1.2% | 66.0% |
| Gyms | 1,889 | 17.6% | 12.8% | 5.7% | 66.5% |
| ENT doctors | 1,433 | 23.8% | 11.7% | 1.4% | 66.7% |
| Landscapers | 1,611 | 17.6% | 19.6% | 4.3% | 66.8% |
| Commercial contractors | 2,156 | 17.8% | 19.1% | 2.6% | 67.5% |
| Business associations | 690 | 18.6% | 13.0% | 1.7% | 68.1% |
| Restaurants | 8,166 | 22.1% | 21.2% | 2.6% | 67.9% |
| Bars | 2,615 | 20.1% | 21.0% | 4.0% | 68.6% |
| Mortgage brokers | 5,470 | 16.1% | 18.5% | 5.1% | 69.0% |
| Publishers | 1,727 | 12.3% | 20.8% | 5.5% | 69.3% |
| Real estate agents | 17,873 | 17.3% | 14.1% | 4.6% | 69.5% |
| Anesthesiologists | 1,435 | 14.2% | 15.5% | 2.0% | 71.1% |
| Hotels | 9,964 | 7.2% | 14.1% | 1.0% | 71.8% |
| Printing companies | 2,740 | 15.0% | 14.7% | 2.5% | 71.9% |
| Hospitals | 3,667 | 15.0% | 11.9% | 1.7% | 72.0% |
| Oncologists | 2,361 | 11.2% | 7.7% | 9.9% | 72.1% |
| Cardiologists | 2,545 | 11.6% | 15.6% | 0.4% | 72.6% |
| Car dealerships | 6,544 | 17.7% | 15.4% | 4.2% | 73.9% |
| Newspapers | 1,566 | 11.3% | 15.3% | 3.1% | 73.9% |
| Medical device makers | 1,240 | 12.6% | 15.0% | 2.7% | 73.9% |
| Neurologists | 1,564 | 16.3% | 12.5% | 1.3% | 74.2% |
| Surgeons | 3,248 | 15.0% | 12.7% | 1.0% | 74.3% |
| Electricians | 1,122 | 13.5% | 16.3% | 1.4% | 75.0% |
| Travel agencies | 3,079 | 12.9% | 16.5% | 3.7% | 75.3% |
| Event companies | 2,164 | 12.5% | 15.3% | 3.3% | 75.6% |
| Pathologists | 530 | 17.2% | 11.3% | 3.2% | 76.2% |
| Endocrinologists | 2,313 | 12.9% | 11.7% | 1.4% | 76.7% |
| Butcher shops | 818 | 13.4% | 13.8% | 2.0% | 76.8% |
| Radiologists | 2,706 | 10.4% | 11.8% | 1.3% | 77.0% |
| Accountants | 10,086 | 10.9% | 16.0% | 1.5% | 77.2% |
| Museums | 1,382 | 9.5% | 16.9% | 2.7% | 77.9% |
| Biotech companies | 1,015 | 12.0% | 14.9% | 0.9% | 77.9% |
| Family physicians | 3,381 | 12.7% | 10.9% | 1.0% | 78.2% |
| Beauty salons | 1,787 | 11.5% | 14.3% | 2.6% | 78.6% |
| Wineries | 1,237 | 7.4% | 14.0% | 5.6% | 79.1% |
| Banks and credit unions | 3,032 | 8.5% | 12.5% | 4.6% | 79.9% |
| Oil and gas companies | 1,665 | 10.5% | 14.4% | 0.5% | 80.1% |
| Private equity firms | 930 | 12.9% | 12.6% | 1.6% | 80.2% |
| Architects | 5,805 | 9.5% | 13.3% | 0.9% | 81.5% |
| Record labels | 866 | 8.1% | 11.9% | 1.8% | 82.0% |
| Churches | 17,664 | 7.0% | 8.9% | 1.3% | 87.2% |
| Podiatrists | 416 | 6.7% | 7.5% | 0.7% | 87.5% |
| Pharmacies | 7,855 | 7.9% | 7.8% | 0.4% | 88.5% |