The short answer
18.8% of the 367,330 small and local business listings in our 435 lists have no website, about one in five. The rate runs from 54.2% of anesthesiologists and 45.3% of auto repair shops down to 4.5% of plastic surgeons. 86.8% of the businesses without a site list a phone number, and a few thousand use a Facebook, Instagram or Linktree page in place of a site.
For a web design agency, a business with no website is the simplest prospect there is. There is nothing to compare against and nothing to migrate. For anyone else selling to small businesses, it changes how you reach them: no site means no contact form, and usually no published email. We counted which listings in our ready-made lists link to a website and which don't.
How we measured it
Every row in our lists starts as a business listing on the map, with a name, category, address, phone, hours and a website field that is either filled in or left empty. A business counts as having no website when that field is empty. We used the website field from all 435 lists, 367,330 listings in total, built in November 2026.
How a listing is counted
- 1367,330 listings435 lists, every US state we cover
- 2Website field readas the listing shows it
- 3Empty fieldcounted as no website
- 4Social page in the fieldcounted as a website, reported separately
- 5Split by industry, state, reviewslisting fields only
Two notes on the base. A listing with a Facebook page or a Linktree in the website field counts as having a website here, because the owner put a link there; we report those separately below. And the comparison of emails and social profiles uses only our 323 finished lists (285,744 businesses), because the other 112 lists didn't go through our website email search yet.
Which industries have no website
Listings with no website, by industry
The top two are a special case. Anesthesiologists and pathologists mostly work inside hospitals, so their listings are individual doctors who never needed a site of their own. Don't read 54.2% as a market for web design. The real opportunity starts at number three: auto repair shops (45.3%), butcher shops (42.9%), beauty salons (38.0%), cleaning companies (30.0%), bars (29.9%), accountants (28.5%) and churches (26.7%). These are owner-run businesses that live on walk-ins, referrals and the phone.
At the other end, golf courses have the lowest rate of all (3.9%), followed by plastic surgeons (4.5%), banks and credit unions (5.5%), museums (5.9%), allergists (7.0%), bed and breakfasts (8.1%), financial advisors (8.3%) and mortgage brokers (8.6%). These are trades where buyers research before they call, so a site is part of the cost of doing business.
Rates and headcounts point to different targets. By count, the biggest pools of no-website businesses in our lists are churches (about 7,200 listings), accountants (about 4,600), real estate agents (about 3,700) and restaurants (about 3,400), simply because those lists are large. Auto repair and salons have the higher rates but fewer listings. If you need volume for a campaign, start with the big trades; if you need the best hit rate per call, start with the high-rate ones.
Accountants are the surprise in the top ten. More than one in four accounting listings has no website. Many look like small practices that run on referrals and repeat tax clients. That is a well-paid group that still needs a basic site, a booking page and a way to collect documents. Our CPA email list covers the ones we could reach by email.
Smaller businesses are far less likely to have a site
Review count on the listing is the best size proxy we have, and it splits the no-website rate more sharply than anything else. 40.8% of businesses with no reviews have no website. At 200 or more reviews it is 4.5%. The median business without a site has 3 reviews; the median one with a site has 24. More on that curve in review counts by industry.
No website, by number of reviews on the listing
For a website seller, the sweet spot is the 10 to 49 review band: 13.6% have no site, and those businesses have enough customers to pay for one. Businesses with no reviews and no site are often new, very small, or barely active.
By state
Among states with 500 or more listings in our lists, South Dakota (34.4% no website) and Mississippi (31.7%) are highest, then Louisiana (23.6%), South Carolina (23.0%), Kansas (22.9%) and California (22.2%). Maine (7.8%), Kentucky (8.0%), Arizona (10.9%), Utah (11.5%), Idaho (11.9%) and Colorado (12.3%) are lowest. Our lists cover different trades in different states, so part of each gap is industry mix. Compare the same trade across states when it matters, for example with the Florida lists or California lists.
What businesses without a website use instead
The phone. 86.8% of listings with no website have a phone number on the listing. The listing itself is the rest of their web presence, and it tends to be thin: in our 323 finished lists, only 39.9% of no-website listings are claimed by the owner, against 83.8% of listings with a site, and 52.7% show opening hours against 82.4%.
Listings with and without a website (323 finished lists)
No websiteHas a website
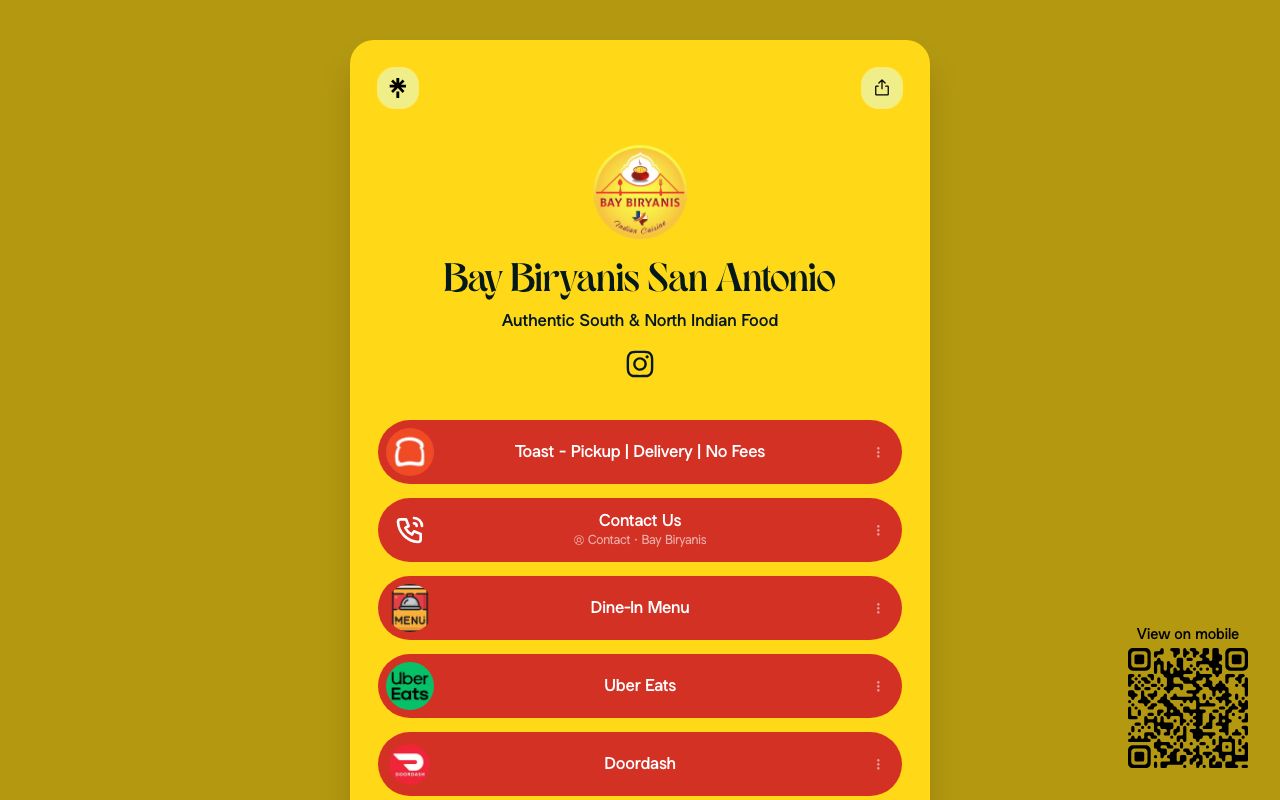
A few thousand owners use a social page as their site. 2,920 listings put a Facebook page in the website field, 488 an Instagram profile and 218 a Linktree. Restaurants do this most by count (633 listings) and bars by rate (8.9% of bar listings), often with a Linktree that points to a menu, an ordering app and delivery services. These businesses have decided they need a web presence and picked the free one, which makes them strong prospects for a real site.
How to sell to businesses with no website
- 01
Call, don't email
86.8% have a phone on the listing, and with no website there is usually no published email to find. A short call at a quiet hour works better than any sequence.
- 02
Pick owner-run trades
Auto repair, salons, cleaning companies, bars, accountants and churches have high no-site rates and a real customer base.
- 03
Filter by reviews
10 to 49 reviews means active customers and money to spend. Skip listings with no reviews unless your offer is very cheap.
- 04
Bring the listing into the pitch
An unclaimed listing or missing hours is an easy first fix and a reason to talk. See unclaimed business listings and listing completeness.
For businesses that do have a site, the next layer of signals is on which website builders small businesses use, tracking by industry and the 2026 overview. For the full method of building a list like this, read how to build a local business lead list.
A Bespoke plan builds a list of businesses with no website in your trade and area, with phone, address, hours and review count, from $99 a month for 2,000 verified leads (Pro: $199 for 5,000). Ready-made lists by trade and area are $29 once, with 12 free sample rows.
Full table: businesses without a website by industry
All 435 lists. "Phone, no-site" is the share of no-website listings that show a phone number. "Claimed" is the share of all listings in the industry claimed by the owner. Industries with fewer than 1,000 listings are left out.
| Industry | Listings | No website | Phone, no-site | Claimed |
|---|---|---|---|---|
| Anesthesiologists | 3,998 | 54.2% | 96.4% | 23.8% |
| Pathologists | 1,496 | 52.4% | 95.3% | 30.9% |
| Auto repair shops | 2,083 | 45.3% | 95.6% | 84.6% |
| Butcher shops | 2,130 | 42.9% | 89.6% | 68.3% |
| Beauty salons | 4,244 | 38.0% | 94.2% | 82.3% |
| Oil and gas companies | 3,180 | 36.4% | 67.8% | 39.3% |
| Travel agencies | 5,561 | 30.1% | 90.8% | 74.3% |
| Cleaning companies | 1,715 | 30.0% | 94.7% | 89.2% |
| Bars | 6,978 | 29.9% | 77.0% | 79.7% |
| Accountants | 16,191 | 28.5% | 95.4% | 64.6% |
| Churches | 26,901 | 26.7% | 72.2% | 45.3% |
| Electricians | 1,668 | 26.7% | 94.8% | 73.8% |
| Landscapers | 2,281 | 25.3% | 94.4% | 87.5% |
| Pediatricians | 6,878 | 24.6% | 94.9% | 62.2% |
| Radiologists | 4,051 | 24.4% | 92.2% | 61.6% |
| Medical device makers | 1,976 | 23.7% | 86.8% | 63.7% |
| Publishers | 2,471 | 23.6% | 82.0% | 58.8% |
| HVAC and plumbing | 2,478 | 22.6% | 95.5% | 90.1% |
| Car dealerships | 11,122 | 22.1% | 86.9% | 80.0% |
| Newspapers | 2,192 | 22.0% | 91.9% | 46.9% |
| Chiropractors | 6,301 | 21.4% | 95.0% | 76.9% |
| Neurologists | 2,494 | 21.3% | 93.4% | 68.8% |
| Physician offices | 2,569 | 21.3% | 86.9% | 66.6% |
| Record labels | 1,542 | 20.9% | 79.5% | 85.1% |
| Commercial contractors | 6,202 | 20.6% | 94.3% | 80.1% |
| Family physicians | 6,809 | 19.9% | 93.1% | 69.3% |
| Restaurants | 15,755 | 19.8% | 85.1% | 87.5% |
| Event companies | 3,089 | 18.6% | 87.3% | 81.5% |
| Hospitals | 5,171 | 17.8% | 33.6% | 69.4% |
| Pharmacies | 11,554 | 17.3% | 90.9% | 87.3% |
| Dentists | 14,372 | 16.6% | 91.6% | 78.3% |
| Podiatrists | 1,883 | 16.6% | 92.3% | 77.1% |
| Insurance companies | 4,483 | 16.4% | 95.9% | 86.4% |
| Personal care studios | 1,197 | 15.9% | 91.1% | 94.1% |
| Printing companies | 5,979 | 15.9% | 93.7% | 85.6% |
| Surgeons | 4,557 | 15.8% | 94.2% | 75.7% |
| Cardiologists | 3,523 | 14.7% | 91.3% | 76.4% |
| Real estate agents | 25,587 | 14.3% | 93.7% | 90.0% |
| Stockbrokers | 1,792 | 14.1% | 86.5% | 73.4% |
| Roofers | 2,116 | 13.9% | 94.6% | 88.9% |
| Nursing homes | 9,351 | 13.8% | 86.7% | 83.8% |
| Home builders | 1,863 | 13.6% | 83.1% | 87.3% |
| Aerospace manufacturers | 1,802 | 13.4% | 74.7% | 54.8% |
| Urologists | 5,431 | 13.0% | 91.5% | 77.1% |
| Gyms | 3,415 | 12.9% | 68.1% | 89.2% |
| Interior designers | 1,807 | 12.3% | 91.4% | 85.6% |
| Orthopedic surgeons | 2,220 | 12.3% | 91.6% | 80.1% |
| Architects | 7,719 | 12.2% | 93.3% | 70.4% |
| Biotech companies | 1,269 | 12.1% | 71.2% | 62.7% |
| Colleges | 4,516 | 11.8% | 52.4% | 57.5% |
| Hotels | 12,276 | 11.8% | 86.6% | 90.7% |
| Dermatologists | 1,960 | 11.4% | 86.1% | 81.1% |
| Veterinarians | 1,145 | 11.2% | 98.4% | 77.7% |
| Oncologists | 3,367 | 11.1% | 92.8% | 80.5% |
| Advertising agencies | 12,422 | 10.9% | 90.0% | 87.5% |
| Therapists | 3,608 | 10.8% | 87.9% | 84.4% |
| Ophthalmologists | 2,316 | 10.3% | 91.2% | 81.1% |
| Endocrinologists | 3,080 | 10.2% | 86.3% | 79.8% |
| Private equity firms | 1,126 | 9.8% | 88.2% | 68.4% |
| ENT doctors | 3,906 | 9.5% | 94.1% | 80.0% |
| Business associations | 1,236 | 9.3% | 89.6% | 71.7% |
| Law firms | 2,172 | 9.0% | 93.8% | 86.4% |
| Wineries | 1,368 | 8.9% | 68.9% | 80.5% |
| Mortgage brokers | 7,477 | 8.6% | 93.8% | 91.7% |
| Financial advisors | 7,864 | 8.3% | 94.0% | 85.5% |
| Bed and breakfasts | 1,883 | 8.1% | 79.1% | 86.7% |
| Allergists | 1,436 | 7.0% | 96.0% | 83.3% |
| Museums | 1,929 | 5.9% | 47.4% | 71.3% |
| Banks and credit unions | 4,697 | 5.5% | 56.6% | 86.7% |
| Plastic surgeons | 3,829 | 4.5% | 93.0% | 90.2% |
| Golf courses | 1,153 | 3.9% | 71.1% | 78.2% |