The short answer
6.9% of the 223,784 small business websites we crawled in November 2026 still have a Universal Analytics (UA-) property ID in their HTML. Google stopped processing standard Universal Analytics data on July 1, 2023. Hotels (13.2%), insurance companies (13.0%), colleges and urologists (12.6%) and dentists (12.2%) carry it most. 44.7% of those sites show no Google tag next to it.
Universal Analytics was the standard version of Google Analytics for years. Google replaced it with Google Analytics 4 and switched it off in stages. Plenty of small business websites never got the memo: the old tracking snippet is still in the page, sending visits to a property that no longer records them. We checked every website in our ready-made lists for one.
What Google switched off, and when
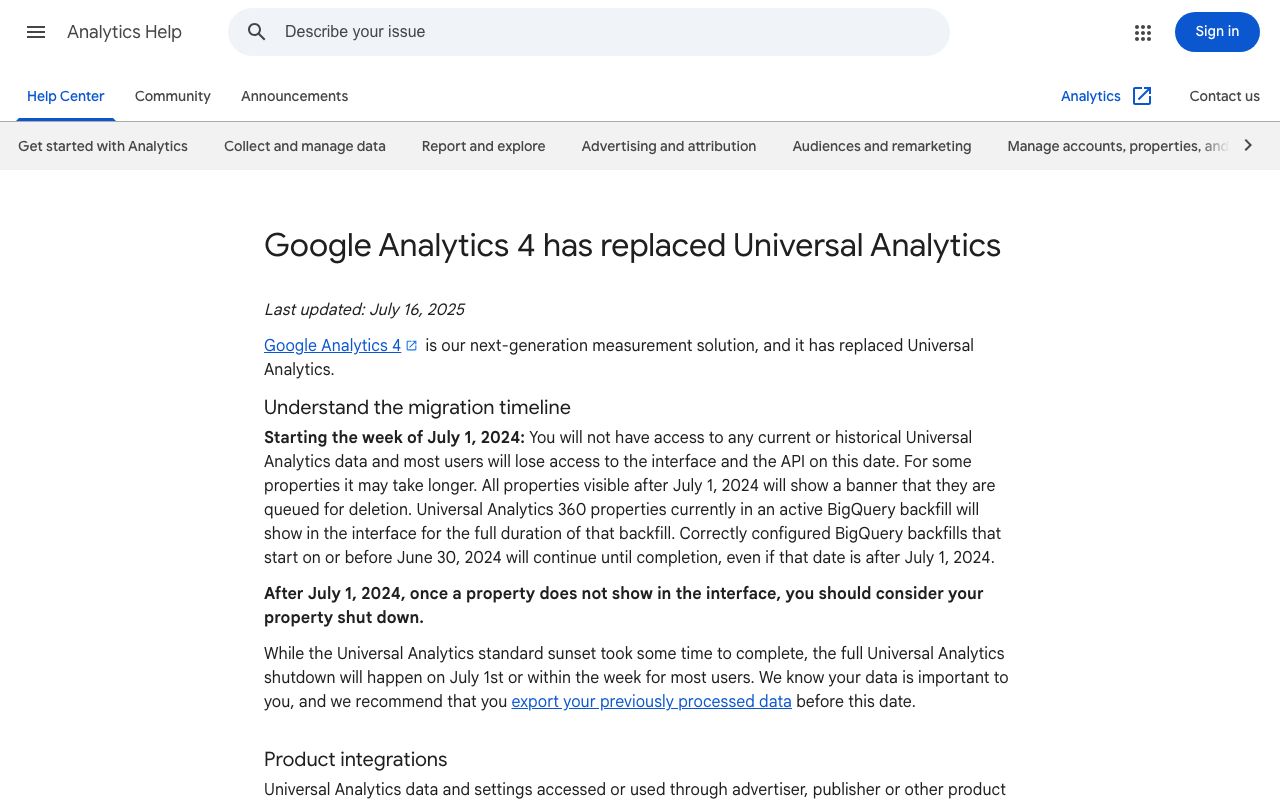
Google's help page is direct about it. Standard Universal Analytics properties stopped processing hits starting July 1, 2023. Paying Universal Analytics 360 customers got a one-time extension to July 1, 2024. From the week of July 1, 2024, all users lost access to the Universal Analytics interface and API, including historical data. Google's announcement is the source for all three dates.
So a UA- ID in a site's HTML means one of two things. Either the business also runs Google Analytics 4 and nobody cleaned up the old code, or the UA- snippet is the only analytics on the site and the owner has had no visitor data since mid-2023. Both are worth a conversation. The second is a broken tool the owner probably doesn't know is broken.
For scale: 15.7% of the same sites carry a GA4 (G-) ID and 16.8% load the Google tag. So for every two small business sites that moved to GA4, roughly one still carries the old UA- code. More than three years after the switch-off, the cleanup on small business sites is far from done.
How we measured it
How a site lands in the UA count
- 1223,784 sites crawledhome page HTML, November 2026
- 2Analytics ID readUA-, G- or none
- 3Google tag checkedpresent or not
- 4Counted per listingand again per unique domain
For each site we record the Google Analytics ID found in the page (a UA- ID for Universal Analytics, a G- ID for Google Analytics 4) and whether the Google tag is present. Our crawl keeps one Analytics ID per site, so a site may carry a UA- ID and a G- ID together; we only count the UA- one here. Where a UA- ID turns up with no Google tag at all, it is very likely the only analytics on the site. That's 6,896 listings, or 3.1% of all crawled sites.
We also count by unique domain, because chains repeat. Choice Hotels' franchise pages alone account for 1,145 hotel listings with a UA- ID. Counted once per website, the overall rate barely moves (9,812 of 147,526 domains, 6.7%), but some industries change a lot, as the table at the end shows.
Which industries still run Universal Analytics
Sites with a UA- code, by industry (per listing)
Counted per unique website, the cleanest top of the list is insurance companies (12.9%), colleges and plastic surgeons (12.4% each) and dentists (11.7%, 783 dental websites). Hotels drop to 6.3% once the Choice Hotels pages are counted once. These trades mostly buy their websites from agencies. The likely story is a site built and tagged years ago, then left without anyone paid to maintain it. The tracking stayed; the upkeep stopped.
The lowest rates come from two very different groups. Pharmacies (1.3%) and car dealerships (3.2%) are mostly chain or vendor-run sites where a central team migrated everything. Beauty salons (2.6%) and churches (3.7%) are low for the opposite reason: many never installed analytics in the first place. See website tracking by industry for the full picture.
The per-site count also moves some trades up. Oncologists go from 4.6% per listing to 10.2% per unique site, financial advisors from 5.4% to 9.1%, and banks from 6.3% to 9.1%. In those trades a few large networks with clean, modern tracking own hundreds of listings each, which hides the independent practices and branches still running old code. If you sell to independents, the per-site column is the one to read.
WordPress sites and bigger businesses carry it most
UA- code rate by website builder
Share with a UA- codeShare with a GA4 (G-) code
WordPress sites hold UA- codes at 10.8%, nine times the Wix rate. That fits how the code got there: on WordPress someone pasted the snippet into a theme or a plugin, and it stays until someone takes it out. Hosted builders such as Wix and GoDaddy's builder manage analytics through their own settings, so the old code mostly went away when the platform changed. More on builders in which website builders small businesses use.
Size points the same way. Businesses with 200 or more reviews carry a UA- code at 9.8%, against 5.6% for businesses with none. The bigger business is more likely to have set up analytics years ago, and just as likely to have stopped looking at it. By state, Minnesota (10.0%), North Carolina (9.4%), Missouri, Virginia and Wisconsin (9.2% each) top the list. Massachusetts (4.1%), Michigan (4.3%) and Washington (4.9%) are lowest, among states with 1,500 or more crawled sites.
Sites with a UA- code, by number of reviews on the listing
Put the two charts together and the best prospects are clear: established WordPress sites, 50 or more reviews, in trades that buy from agencies. Those owners have money, had analytics once, and have been flying blind or carrying dead code since 2023. For the review side of the picture, see review counts by industry.
Old analytics and old code travel together. The outdated WordPress study finds 28.9% of versioned WordPress sites below 6.0. Many of the sites in both groups are the same set of sites nobody has touched.
Why this is a sales opening for agencies
Most cold pitches to small businesses are vague: "we can improve your SEO". A UA- finding is concrete, true, and checkable by the owner: "Your site still loads a Universal Analytics code; Google stopped recording that data on July 1, 2023." If the site has no GA4 or Google tag, add the cost: they've had no visitor numbers for over three years. That opens a GA4 setup, a tag audit, a care plan or a full rebuild.
- 01
Check the site yourself first
View the page source and search for "UA-" and "G-". If there is a G- ID too, pitch cleanup and a tag audit. If there is only the UA- ID, pitch the missing data.
- 02
Lead with Google's date, not your opinion
Quote the July 1, 2023 shutdown and link to Google's page. The owner can verify it in a minute.
- 03
Pick the trades with budget
Dentists, plastic surgeons, insurance agencies and urology practices all run above 11% and spend on marketing.
- 04
Keep the first email short
One finding, one offer, one question. Our cold email guide has examples that work on local businesses.
A Bespoke plan builds a list of businesses with this exact signal, such as dentists in Florida with a UA- code and no Google tag. Starter is $99 a month for 2,000 verified leads, Pro $199 a month for 5,000. Ready-made lists by trade and area are $29 once.
Full table: Universal Analytics by industry
Per listing counts each business listing once. Per unique site counts each website domain once, so chains and hospital systems count one time. GA4 is the share of listings whose site carries a G- ID. Industries with fewer than 400 crawled sites are left out, and a dash means too few sites for a per-domain rate. Related: SEO basics, businesses with no website, 2026 overview.
| Industry | Sites crawled | UA- per listing | UA- per unique site | GA4 (G-) |
|---|---|---|---|---|
| Hotels | 9,964 | 13.2% | 6.3% | 7.2% |
| Insurance companies | 2,820 | 13.0% | 12.9% | 17.2% |
| Urologists | 4,291 | 12.6% | 8.8% | 18.9% |
| Colleges | 3,337 | 12.6% | 12.4% | 18.0% |
| Dentists | 9,560 | 12.2% | 11.7% | 23.5% |
| Plastic surgeons | 3,553 | 12.1% | 12.4% | 28.4% |
| Allergists | 1,277 | 11.8% | 10.4% | 22.8% |
| Pediatricians | 3,916 | 10.8% | 9.7% | 17.2% |
| Business associations | 690 | 10.7% | 10.9% | 18.6% |
| Nursing homes | 6,288 | 9.4% | 9.9% | 26.6% |
| Interior designers | 752 | 8.8% | 8.8% | 18.0% |
| Home builders | 1,551 | 8.7% | 7.9% | 19.3% |
| Newspapers | 1,566 | 8.4% | 8.8% | 11.3% |
| Law firms | 1,963 | 7.9% | 8.3% | 18.7% |
| Advertising agencies | 10,215 | 7.7% | 8.1% | 19.5% |
| Hospitals | 3,667 | 7.6% | 11.1% | 15.0% |
| Dermatologists | 1,654 | 7.6% | 9.6% | 25.3% |
| Chiropractors | 1,418 | 7.5% | 7.4% | 25.5% |
| HVAC and plumbing | 1,811 | 7.5% | 7.9% | 23.1% |
| Ophthalmologists | 1,246 | 7.5% | 8.8% | 18.1% |
| Accountants | 10,086 | 7.4% | 7.0% | 10.9% |
| Museums | 1,382 | 7.4% | 7.2% | 9.5% |
| Radiologists | 2,706 | 7.2% | 8.2% | 10.4% |
| Mortgage brokers | 5,470 | 7.0% | 5.4% | 16.1% |
| Stockbrokers | 994 | 7.0% | 8.3% | 23.8% |
| Cardiologists | 2,545 | 6.9% | 8.2% | 11.6% |
| Roofers | 1,735 | 6.9% | 6.9% | 20.9% |
| Wineries | 1,237 | 6.8% | 6.6% | 7.4% |
| Surgeons | 3,248 | 6.6% | 9.5% | 15.0% |
| Cleaning companies | 1,088 | 6.5% | 6.2% | 15.5% |
| Commercial contractors | 2,156 | 6.4% | 6.5% | 17.8% |
| Banks and credit unions | 3,032 | 6.3% | 9.1% | 8.5% |
| Orthopedic surgeons | 1,310 | 6.3% | 8.5% | 25.0% |
| Auto repair shops | 971 | 6.3% | 6.0% | 16.4% |
| Gyms | 1,889 | 6.2% | 5.4% | 17.6% |
| Medical device makers | 1,240 | 5.9% | 6.5% | 12.6% |
| Real estate agents | 17,873 | 5.7% | 5.9% | 17.3% |
| Butcher shops | 818 | 5.7% | 4.7% | 13.4% |
| Printing companies | 2,740 | 5.6% | 6.2% | 15.0% |
| Architects | 5,805 | 5.5% | 5.3% | 9.5% |
| Travel agencies | 3,079 | 5.5% | 5.2% | 12.9% |
| Oil and gas companies | 1,665 | 5.5% | 4.4% | 10.5% |
| Financial advisors | 5,402 | 5.4% | 9.1% | 29.7% |
| Bars | 2,615 | 5.4% | 4.9% | 20.1% |
| Publishers | 1,727 | 5.4% | 5.6% | 12.3% |
| Biotech companies | 1,015 | 5.4% | 5.7% | 12.0% |
| Record labels | 866 | 5.3% | 3.7% | 8.1% |
| Landscapers | 1,611 | 5.2% | 5.0% | 17.6% |
| Restaurants | 8,166 | 5.1% | 4.6% | 22.1% |
| ENT doctors | 1,433 | 5.0% | 5.9% | 23.8% |
| Anesthesiologists | 1,435 | 4.7% | 6.8% | 14.2% |
| Event companies | 2,164 | 4.7% | 4.7% | 12.5% |
| Family physicians | 3,381 | 4.6% | 7.7% | 12.7% |
| Oncologists | 2,361 | 4.6% | 10.2% | 11.2% |
| Endocrinologists | 2,313 | 4.6% | 6.7% | 12.9% |
| Private equity firms | 930 | 4.4% | 4.5% | 12.9% |
| Physician offices | 966 | 3.8% | 6.5% | 20.5% |
| Electricians | 1,122 | 3.8% | 4.1% | 13.5% |
| Churches | 17,664 | 3.7% | 3.2% | 7.0% |
| Neurologists | 1,564 | 3.3% | 4.6% | 16.3% |
| Car dealerships | 6,544 | 3.2% | 2.8% | 17.7% |
| Pathologists | 530 | 2.8% | - | 17.2% |
| Beauty salons | 1,787 | 2.6% | 2.2% | 11.5% |
| Podiatrists | 416 | 1.7% | - | 6.7% |
| Pharmacies | 7,855 | 1.3% | 4.8% | 7.9% |