The short answer
Most listings say yes. Of 367,330 US business listings we collected in November 2026, 83.7% list a wheelchair accessible parking lot, 76.1% an accessible entrance, 46.1% an accessible restroom and 10.6% accessible seating. These are self-reported listing attributes. When a listing answers at all, about 99% of answers are yes, so a missing answer tells you more than an explicit no.
Every map listing can carry a short block of attributes: accessibility, amenities, payments, who owns the business. Owners can fill it in, and visitors get asked about it. We collected that block for every business in our ready-made lists and counted the accessibility answers. The result is an industry-by-industry view of self-reported wheelchair access across US small and local businesses.
What the attributes measure, and what they don't
Read these numbers as what listings say, not as an audit. Nobody from our side measured a ramp or a door width. The attribute is a yes or no toggle on the listing, set by the owner or confirmed by visitors who answer a prompt. That makes it useful for two jobs: seeing which industries talk about access at all, and finding businesses whose listing is silent.
How an accessibility answer reaches our data
- 1Map listingevery row in our 435 list files
- 2About block87.2% carry an Accessibility section
- 3Each featureyes, an explicit no, or left blank
- 4Counted per industryshare of all listings, and of listings that answer
Three patterns stand out. First, an explicit no is rare. Only 0.9% of listings say their entrance is not accessible, against 76.1% that say it is. Of listings that answer the entrance question, 98.8% answer yes. For parking it is 99.0% and for restrooms 97.8%. Second, the gaps are mostly blanks: 23.0% of listings say nothing about the entrance. Third, claiming a listing makes no difference. Claimed listings carry an accessibility section 86.9% of the time, unclaimed ones 87.9%, which suggests most of these answers come from visitors and the platform rather than from owners.
Share of all listings marked yes vs explicitly no
YesExplicit no
The assistive hearing loop is the one feature where no beats yes: 1.4% of listings say they don't have one and 0.5% say they do. Churches (2.3%) and dentists (2.7%) report loops most often. Elevator access does not show up as an attribute in our files.
Accessibility by industry
The spread between industries is wide, and it follows the kind of building the business works from. Medical practices sit at the top: ophthalmologists, ENT doctors, urologists and family physicians all list an accessible entrance more than 95% of the time and an accessible restroom almost as often. Churches are close behind (94.9% entrance, 90.3% restroom). At the bottom are trades that work at the customer's address: electricians (3.1% entrance), landscapers (7.9%), HVAC and plumbers (8.6%) and cleaning companies (9.0%). Their listings often have no public premises to describe.
Listings with a wheelchair accessible entrance
Restrooms split the office world from the clinic world. Real estate agents list an accessible entrance 78.3% of the time but an accessible restroom only 8.2%. Banks: 94.6% entrance, 5.0% restroom. Pharmacies: 96.2% entrance, 10.6% restroom. Offices and counters rarely get asked about restrooms, while clinics, restaurants and churches do. Seating is a restaurant and bar attribute: restaurants list accessible seating 78.6% of the time and bars 41.7%, while almost no one else reports it.
Listings with a wheelchair accessible restroom
The "all three" measure (parking, entrance and restroom all marked accessible) shows the split most clearly. Ophthalmologists reach 95.3%, physician offices 94.2%, dentists 92.7% and churches 88.2%. Restaurants manage 67.7% and bars 72.7%. Accountants fall to 34.4%, real estate agents to 7.5% and architects to 2.7%. Nothing in the data says those offices are inaccessible. Their listings simply never get asked, or never answer, the restroom question.
State totals vary too. Listings in Utah (92.2%) and Michigan (91.7%) report an accessible entrance most often, while North Carolina (56.3%), Virginia (56.7%) and Louisiana (57.1%) report it least. Read that with care: each state's figure mostly reflects which industries we built lists for there. A state with many clinic and church lists will score high; one with many contractor and agency lists will score low. Compare industries first, then states within an industry.
Busier listings answer more questions
Accessibility answers grow with traffic. Listings with no reviews carry an accessible entrance answer 67.7% of the time. At 10 to 49 reviews it is 80.1%, at 50 to 199 reviews 81.1%. Restrooms climb the whole way, from 36.2% with no reviews to 63.4% at 200 or more, partly because restaurants and bars make up much of the busiest group. The same pattern shows up in contact data: busier businesses publish more, as our review counts study and the guide on why more reviews mean more emails show.
Accessibility answers by review count
Accessible entranceAccessible restroom
What the ADA asks of small businesses
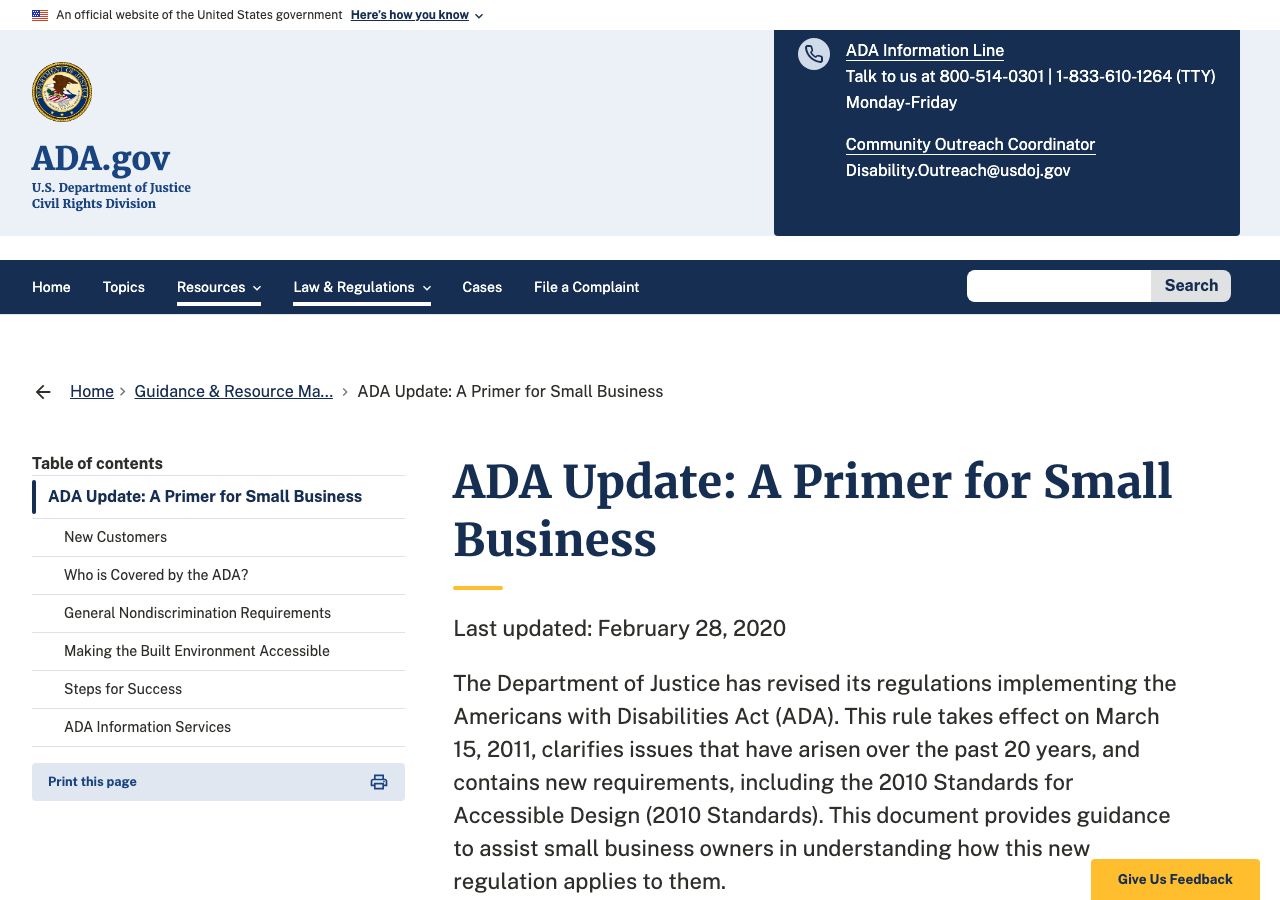
The Americans with Disabilities Act treats businesses that serve the public as public accommodations: stores, restaurants, bars, service businesses, theaters, hotels and more. The Department of Justice's small business primer says these businesses must remove physical barriers when doing so is "readily achievable", which it defines as easy to do without much difficulty or expense. It names accessible parking, an accessible entrance and access to public restrooms among the priorities, and says even a business with four or fewer parking spaces needs one accessible space.
A listing attribute is not proof of compliance either way. A yes can be out of date after a remodel, and a blank can sit on a fully accessible building. If you sell accessibility audits, signage, ramps, restroom refits or ADA-friendly websites, the blank is the opening. This is not legal advice.
How to use this data to find prospects
- 01
Pick industries with public premises
Clinics, restaurants, churches, gyms and salons host visitors, so access matters to their customers. Trades that visit the customer's home rarely need it.
- 02
Look for the blanks
In accountants, 31.2% of listings say nothing about an accessible entrance; in advertising agencies 40.1%. Those businesses never answered, which makes a natural first question on a call.
- 03
Compare entrance and restroom
A listing with an accessible entrance but no restroom answer is common in offices and counters. That gap is where restroom refits and signage get sold.
- 04
Reach the owner
Our lists carry the phone, website and verified emails for each business. Start with a ready-made list for the whole industry, or have a Bespoke plan build one filtered on the accessibility answers.

Full table: accessibility by industry
Shares of all listings in each industry with at least 1,000 listings. "All three" means parking, entrance and restroom all marked accessible. For more on what listings carry, see business listing completeness, unclaimed business listings and the owner attributes in women-owned small businesses and minority and veteran-owned businesses.
| Industry | Listings | Parking | Entrance | Restroom | Seating | All three |
|---|---|---|---|---|---|---|
| Colleges | 4,516 | 96.5% | 98.3% | 8.4% | 6.9% | 8.3% |
| Nursing homes | 9,351 | 97.8% | 98.2% | 20.6% | 19.8% | 20.4% |
| Ophthalmologists | 2,316 | 98.7% | 97.4% | 96.8% | 11.2% | 95.3% |
| ENT doctors | 3,906 | 95.8% | 97.2% | 97.3% | 6.8% | 93.4% |
| Radiologists | 4,051 | 91.8% | 96.6% | 94.8% | 8.1% | 89.7% |
| Urologists | 5,431 | 95.2% | 96.5% | 96.4% | 5.8% | 93.5% |
| Physician offices | 2,569 | 97.4% | 96.3% | 94.9% | 8.4% | 94.2% |
| Pharmacies | 11,554 | 95.8% | 96.2% | 10.6% | 7.7% | 10.5% |
| Golf courses | 1,153 | 97.7% | 96.2% | 27.7% | 6.7% | 27.1% |
| Endocrinologists | 3,080 | 94.9% | 96.1% | 95.5% | 6.9% | 92.1% |
| Oncologists | 3,367 | 95.1% | 96.0% | 95.9% | 11.8% | 92.9% |
| Family physicians | 6,809 | 96.1% | 95.9% | 96.9% | 4.8% | 93.8% |
| Hospitals | 5,171 | 96.2% | 95.9% | 55.3% | 14.7% | 53.9% |
| Dermatologists | 1,960 | 97.3% | 95.9% | 95.7% | 7.8% | 94.1% |
| Pathologists | 1,496 | 90.1% | 95.9% | 95.7% | 1.3% | 89.1% |
| Pediatricians | 6,878 | 92.4% | 95.5% | 95.9% | 7.2% | 90.2% |
| Biotech companies | 1,269 | 96.7% | 95.5% | 2.8% | 1.7% | 2.8% |
| Anesthesiologists | 3,998 | 95.6% | 95.3% | 95.1% | 1.8% | 94.5% |
| Plastic surgeons | 3,829 | 96.4% | 95.1% | 87.3% | 16.3% | 83.5% |
| Aerospace manufacturers | 1,802 | 96.7% | 95.0% | 58.9% | 1.3% | 58.4% |
| Churches | 26,901 | 97.2% | 94.9% | 90.3% | 6.3% | 88.2% |
| Private equity firms | 1,126 | 75.0% | 94.8% | 2.8% | 1.4% | 2.1% |
| Business associations | 1,236 | 87.5% | 94.7% | 5.4% | 4.3% | 5.2% |
| Banks | 4,697 | 98.4% | 94.6% | 5.0% | 6.0% | 4.9% |
| Dentists | 14,372 | 98.5% | 94.3% | 95.4% | 13.2% | 92.7% |
| Neurologists | 2,494 | 92.6% | 94.3% | 94.4% | 6.5% | 90.4% |
| Allergists | 1,436 | 95.3% | 94.0% | 95.9% | 8.8% | 89.7% |
| Stockbrokers | 1,792 | 83.8% | 93.9% | 50.7% | 5.2% | 47.7% |
| Orthopedic surgeons | 2,220 | 95.5% | 93.5% | 93.6% | 9.1% | 92.1% |
| Mortgage brokers | 7,477 | 93.5% | 93.4% | 9.2% | 7.9% | 8.8% |
| Podiatrists | 1,883 | 74.4% | 92.9% | 91.3% | 7.5% | 71.7% |
| Gyms | 3,415 | 95.5% | 92.7% | 79.7% | 5.4% | 78.1% |
| Surgeons | 4,557 | 92.2% | 92.1% | 92.7% | 5.1% | 88.8% |
| Law firms | 2,172 | 96.8% | 91.8% | 68.2% | 10.8% | 64.9% |
| Medical device makers | 1,976 | 92.7% | 91.2% | 4.8% | 2.9% | 4.8% |
| Veterinarians | 1,145 | 98.9% | 91.0% | 83.1% | 6.1% | 79.7% |
| Cardiologists | 3,523 | 86.0% | 90.3% | 89.6% | 7.5% | 83.2% |
| Wineries | 1,368 | 94.6% | 88.8% | 21.8% | 20.3% | 21.3% |
| Chiropractors | 6,301 | 87.6% | 87.5% | 90.4% | 8.6% | 79.1% |
| Beauty salons | 4,244 | 95.9% | 87.5% | 72.0% | 8.0% | 69.2% |
| Restaurants | 15,755 | 82.0% | 86.4% | 76.0% | 78.6% | 67.7% |
| Museums | 1,929 | 85.1% | 85.5% | 81.1% | 10.4% | 71.3% |
| Bars | 6,978 | 83.9% | 85.3% | 85.9% | 41.7% | 72.7% |
| Insurance companies | 4,483 | 93.8% | 84.4% | 10.6% | 10.9% | 9.8% |
| Financial advisors | 7,864 | 92.1% | 83.0% | 75.3% | 5.3% | 67.0% |
| Personal care studios | 1,197 | 93.2% | 79.4% | 61.2% | 13.0% | 55.6% |
| Real estate agents | 25,587 | 93.0% | 78.3% | 8.2% | 7.6% | 7.5% |
| Auto repair shops | 2,083 | 79.4% | 77.5% | 33.4% | 4.4% | 32.1% |
| Butcher shops | 2,130 | 75.1% | 77.0% | 4.8% | 1.7% | 4.6% |
| Therapists | 3,608 | 94.8% | 75.4% | 61.8% | 16.0% | 56.1% |
| Accountants | 16,191 | 93.0% | 67.7% | 38.2% | 3.5% | 34.4% |
| Newspapers | 2,192 | 83.9% | 65.6% | 1.9% | 1.4% | 1.5% |
| Event companies | 3,089 | 84.1% | 61.0% | 15.1% | 5.6% | 13.5% |
| Advertising agencies | 12,422 | 85.2% | 58.8% | 8.9% | 8.3% | 7.0% |
| Printing companies | 5,979 | 66.9% | 57.0% | 5.2% | 4.1% | 4.1% |
| Publishers | 2,471 | 72.1% | 56.9% | 2.5% | 2.1% | 1.8% |
| Architects | 7,719 | 79.6% | 53.6% | 3.8% | 2.9% | 2.7% |
| Interior designers | 1,807 | 76.1% | 53.6% | 4.8% | 4.1% | 3.5% |
| Travel agencies | 5,561 | 72.2% | 51.5% | 3.3% | 3.6% | 2.6% |
| Car dealerships | 11,122 | 69.1% | 47.7% | 7.1% | 6.2% | 5.7% |
| Oil and gas companies | 3,180 | 61.7% | 43.4% | 0.7% | 0.3% | 0.6% |
| Record labels | 1,542 | 60.6% | 35.7% | 7.7% | 5.7% | 5.6% |
| Commercial contractors | 6,202 | 65.2% | 23.8% | 2.6% | 2.3% | 1.7% |
| Roofers | 2,116 | 61.6% | 17.9% | 4.5% | 4.3% | 2.5% |
| Home builders | 1,863 | 21.2% | 10.9% | 3.0% | 2.4% | 1.5% |
| Cleaning companies | 1,715 | 34.9% | 9.0% | 2.9% | 2.9% | 1.8% |
| HVAC and plumbers | 2,478 | 12.0% | 8.6% | 3.7% | 3.2% | 1.5% |
| Landscapers | 2,281 | 32.4% | 7.9% | 1.1% | 1.1% | 0.8% |
| Electricians | 1,668 | 3.8% | 3.1% | 1.2% | 1.2% | 0.7% |
| All industries | 367,330 | 83.7% | 76.1% | 46.1% | 10.6% | 43.3% |
More from the insights hub: payment methods on business listings, opening hours by industry, and the full state of small business websites 2026 report.