The short answer
Of 367,330 US business listings we collected in November 2026, 5.2% (19,159) carry the attribute "identifies as women-owned". It is self-reported and optional, so it is a floor, not a census: the Census Bureau counts 22.9% of US employer firms as women-owned. Personal care studios (29.5%), interior designers (23.7%) and beauty salons (20.0%) tag it most.
Business listings let an owner add identity attributes to the about section: women-owned, veteran-owned, Black-owned, Latino-owned and others. Each one is a choice the owner makes about how the business presents itself. We read those attributes for every business in our ready-made lists, 367,330 listings across 71 industries, and counted the women-owned tag. Related attributes are on our page about minority- and veteran-owned businesses.
A floor, not a census
Read 5.2% as the share of businesses that chose to say so on their listing, not the share that are women-owned. Three things keep the number low. The attribute is optional. It has to be set by someone who controls the listing, which is why 98.4% of the tags in our data sit on listings the owner has claimed. And many owners never open the attributes panel at all. Among claimed listings only, the rate rises to 6.8%.
Women-owned: self-reported on listings vs official counts
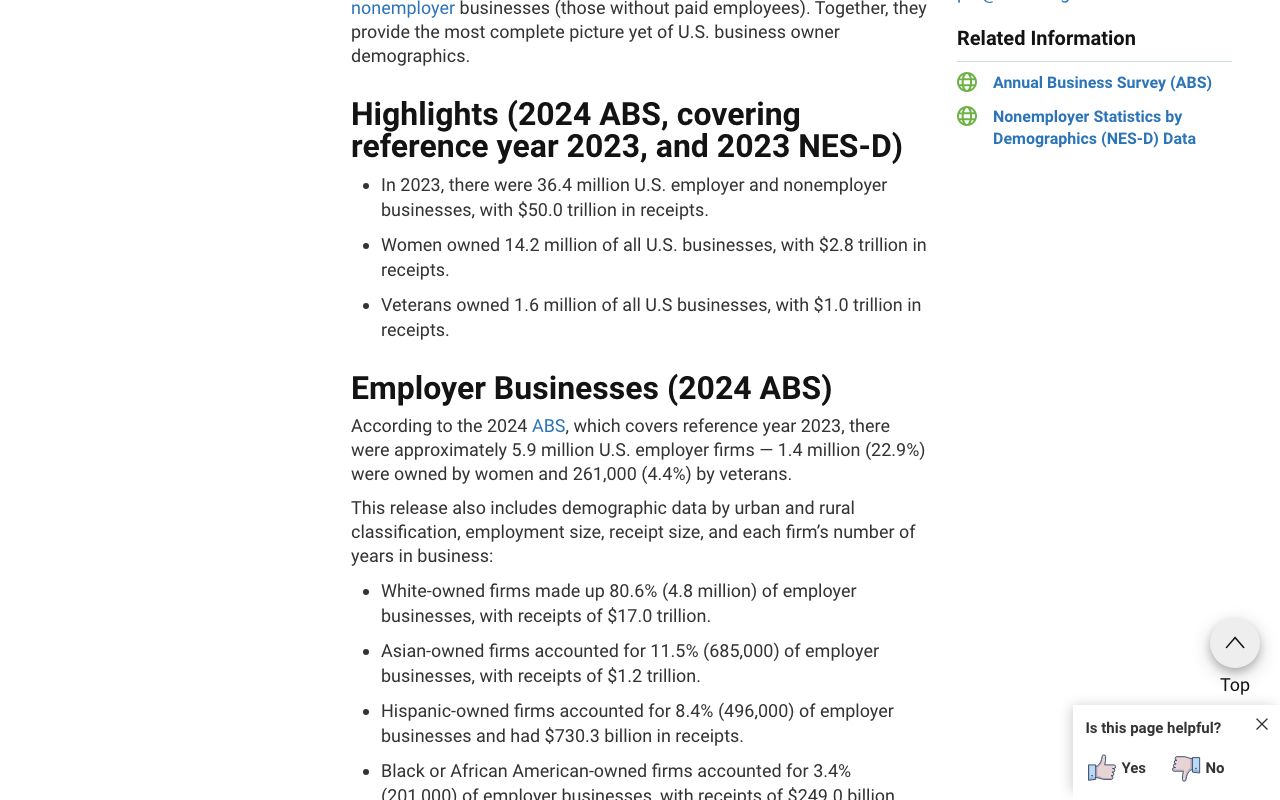
The official numbers come from the Census Bureau's November 2025 release. The 2024 Annual Business Survey, covering 2023, counts about 5.9 million US employer firms, of which 1.4 million (22.9%) were owned by women. Counting businesses without employees too, women owned 14.2 million of 36.4 million US businesses, or 39.0%. The Census defines ownership as holding more than half the equity. The listing attribute has no definition at all beyond the owner's own choice.
Women-owned by industry
Share of listings tagged women-owned: highest
The tag is most common where the owner is the brand. Personal care studios lead at 29.5%, then interior designers (23.7%), event companies (22.0%), therapists (21.8%) and beauty salons (20.0%). Cleaning companies (15.7%) and advertising agencies (14.7%) follow. Real estate agents, at 13.0%, contribute the most tagged listings of any industry: 3,316, because the industry is large in our data. Advertising agencies add 1,821 and restaurants (8.1%) 1,273.
The lowest rates are in industries where the listing belongs to an institution or a practice group rather than an owner: churches (0.2%), pathologists (0.3%), anesthesiologists (0.3%), oil and gas companies (0.3%), urologists (0.4%), banks (0.4%) and hospitals (0.4%). A low rate there says little about who runs the business, only that nobody with a stake in the attribute manages the listing.
The middle of the table
Most of the industries B2B sellers target sit between 5% and 10%. Law firms tag women-owned on 9.7% of listings, wineries 9.6%, printing companies 8.9%, restaurants 8.1%, gyms 7.8%, veterinarians 7.5%, insurance companies 7.0%, dentists 6.7%, chiropractors 6.1%, mortgage brokers 5.5% and accountants 5.0%. Trades run lower: HVAC and plumbing 4.4%, roofers 3.6%, landscapers 2.4%, electricians 1.9%. Every one of them sits far below the 22.9% Census share for all employer firms, so the tagged businesses are the visible part of a larger group.
One more reason the gap is wide: the Census count includes 30.4 million nonemployer businesses, of which women owned 12.9 million (42.3%). Many of those are sole proprietors with no storefront and no listing. Our data covers businesses that have a public listing, which skews toward firms with premises, staff and customers who search for them. The two numbers measure different populations as well as different things.
Women-owned by state
Share tagged women-owned: highest and lowest states (1,500+ listings)
Colorado (12.4%), Idaho (12.1%), Nevada (11.1%) and Arizona (11.1%) have the highest tag rates in our data; Virginia (2.2%), Missouri (3.0%), Michigan (3.1%) and Illinois (3.2%) the lowest. California sits at 4.8%, Texas at 5.7% and Florida at 6.4%. Treat the state ranking with care: our lists cover different industries in different states, and the industry gap (29.5% against 0.2%) is far wider than the state gap. Compare one industry across states before reading anything into geography, as our guide to segmenting a lead list by territory explains.
How the attribute gets onto a listing
From owner to our data
- 1Owner claims the listing75.7% of listings are claimed
- 2Opens the attributesan optional panel most owners skip
- 3Turns on women-ownedself-identified, no proof asked
- 4Shows on the listingas "identifies as women-owned"
- 5We read it19,159 listings, 5.2%
Because the owner sets it, the tag also says something about the listing: tagged listings are claimed, active and usually well kept. Women-owned listings in our data have a median of 37 reviews and an average rating of 4.78, against 33 reviews and 4.51 for claimed listings with no owner-identity tag. That is a difference in the listings, not proof of a difference in the businesses. Our listing completeness score and unclaimed listings study show how much claiming changes a listing.
Some owners tag more than one identity: 6,431 listings carry two or more owner attributes, for example women-owned and Latino-owned. 7.4% of all listings carry at least one owner-identity tag of any kind.
Women-owned is by far the most common owner tag on listings. In our data 19,159 listings carry it, against 4,756 Latino-owned, 4,043 veteran-owned, 3,651 Black-owned, 2,489 Asian-owned and 860 LGBTQ+ owned. The minority- and veteran-owned businesses page breaks those down by industry. The tag is also a snapshot: we read it in November 2026, and owners can add or remove it at any time.
Who uses this data, and how
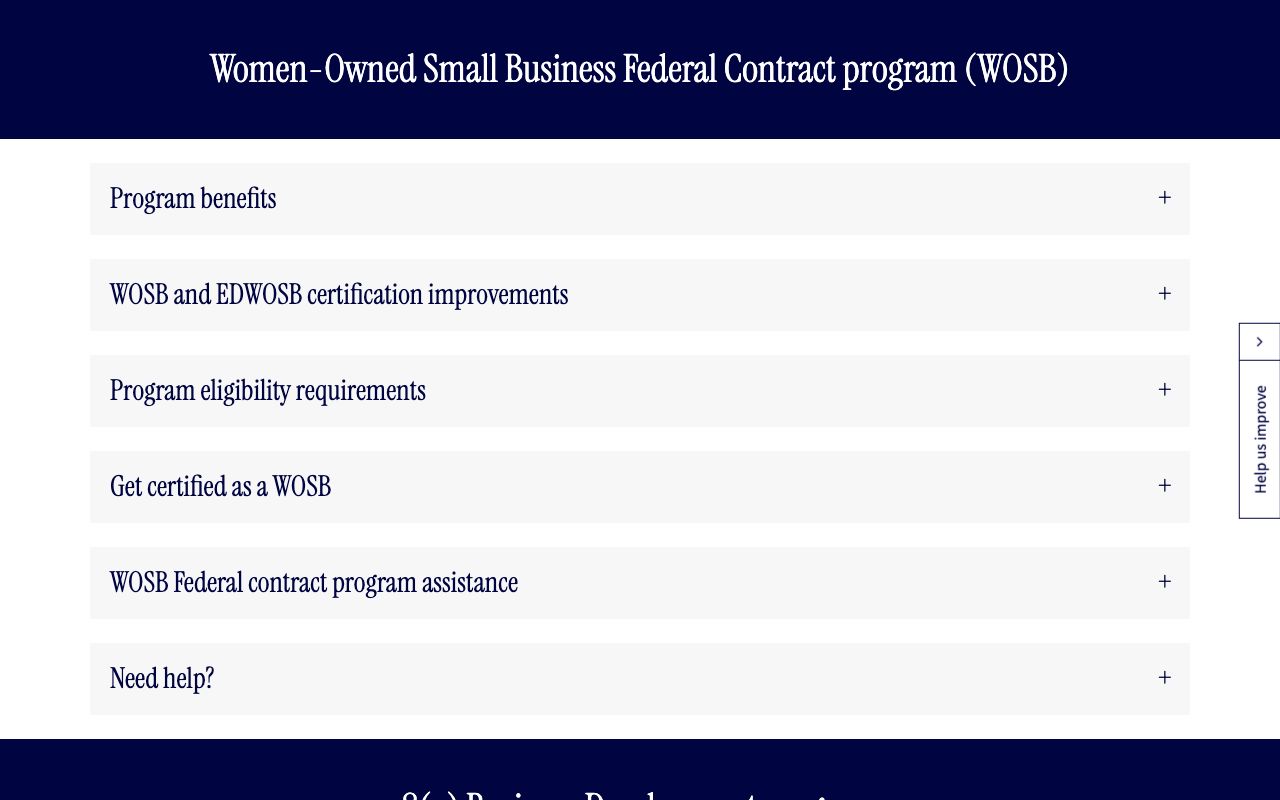
The tag is useful wherever ownership is the point of the conversation. Supplier diversity teams look for women-owned vendors. Banks, lenders and grant programs run offers aimed at women business owners. Certification consultants help firms qualify for programs such as the SBA's Women-Owned Small Business Federal Contract program, which requires a business to be at least 51% owned and controlled by women who are US citizens; the federal government's goal is to award 5% of prime contracting dollars to women-owned small businesses.
- 01
Use the tag as a starting point
It finds businesses that chose to identify. It will miss most women-owned firms, so don't treat an untagged business as not women-owned.
- 02
Lead with relevance
Write about the program, grant or contract the owner qualifies for, not about the tag. People respond to a useful offer.
- 03
Keep it respectful
Don't guess identity from a name or photo. Use only what the business has published about itself.
- 04
Combine with industry and area
Women-owned salons in Colorado is a list; women-owned businesses in general is not.
Ready-made lists cover whole industries and areas with verified emails, phone, website and listing details; the owner-identity attributes are not a column in those files. To get only businesses tagged women-owned, in your industries and states, a Bespoke plan builds the list to that brief. Check any file against our lead list quality checklist first.
Full table: women-owned by industry
| Industry | Listings | Women-owned tag | Tagged listings | Any owner-identity tag |
|---|---|---|---|---|
| Personal care studios | 1,197 | 29.5% | 353 | 34.6% |
| Interior designers | 1,807 | 23.7% | 428 | 25.5% |
| Event companies | 3,089 | 22.0% | 679 | 24.1% |
| Therapists | 3,608 | 21.8% | 788 | 23.6% |
| Beauty salons | 4,244 | 20.0% | 848 | 23.5% |
| Cleaning companies | 1,715 | 15.7% | 270 | 22.9% |
| Advertising agencies | 12,422 | 14.7% | 1,821 | 20.4% |
| Real estate agents | 25,587 | 13.0% | 3,316 | 15.9% |
| Travel agencies | 5,561 | 12.1% | 672 | 15.1% |
| Law firms | 2,172 | 9.7% | 211 | 16.7% |
| Wineries | 1,368 | 9.6% | 131 | 11.9% |
| Printing companies | 5,979 | 8.9% | 532 | 13.3% |
| Restaurants | 15,755 | 8.1% | 1,273 | 13.6% |
| Gyms | 3,415 | 7.8% | 265 | 13.3% |
| Veterinarians | 1,145 | 7.5% | 86 | 7.9% |
| Plastic surgeons | 3,829 | 7.3% | 281 | 10.8% |
| Bars | 6,978 | 7.2% | 503 | 10.6% |
| Insurance companies | 4,483 | 7.0% | 314 | 11.2% |
| Dentists | 14,372 | 6.7% | 956 | 8.9% |
| Chiropractors | 6,301 | 6.1% | 381 | 8.1% |
| Allergists | 1,436 | 5.6% | 80 | 6.5% |
| Mortgage brokers | 7,477 | 5.5% | 411 | 10.2% |
| Accountants | 16,191 | 5.0% | 808 | 6.7% |
| HVAC and plumbing | 2,478 | 4.4% | 108 | 11.1% |
| Dermatologists | 1,960 | 4.3% | 85 | 5.6% |
| Bed and breakfasts | 1,883 | 4.3% | 81 | 4.6% |
| Ophthalmologists | 2,316 | 4.2% | 97 | 5.8% |
| Publishers | 2,471 | 4.1% | 102 | 5.7% |
| Roofers | 2,116 | 3.6% | 76 | 9.4% |
| Museums | 1,929 | 3.5% | 68 | 5.2% |
| Podiatrists | 1,883 | 3.5% | 66 | 5.0% |
| Architects | 7,719 | 3.5% | 268 | 4.9% |
| Physician offices | 2,569 | 3.5% | 89 | 4.0% |
| Newspapers | 2,192 | 3.1% | 68 | 4.4% |
| Medical device makers | 1,976 | 3.0% | 59 | 4.4% |
| Pediatricians | 6,878 | 2.7% | 188 | 3.3% |
| Record labels | 1,542 | 2.7% | 42 | 11.9% |
| Nursing homes | 9,351 | 2.6% | 242 | 2.9% |
| Landscapers | 2,281 | 2.4% | 55 | 8.1% |
| Financial advisors | 7,864 | 2.3% | 181 | 3.8% |
| Commercial contractors | 6,202 | 2.3% | 140 | 5.9% |
| Auto repair shops | 2,083 | 2.2% | 46 | 8.9% |
| Endocrinologists | 3,080 | 2.2% | 68 | 2.6% |
| Butcher shops | 2,130 | 2.2% | 47 | 4.7% |
| Business associations | 1,236 | 2.1% | 26 | 3.2% |
| Pharmacies | 11,554 | 2.1% | 239 | 2.5% |
| Biotech companies | 1,269 | 2.0% | 25 | 2.4% |
| Stockbrokers | 1,792 | 1.9% | 35 | 3.4% |
| Car dealerships | 11,122 | 1.9% | 213 | 4.5% |
| Electricians | 1,668 | 1.9% | 31 | 6.3% |
| Oncologists | 3,367 | 1.8% | 60 | 2.0% |
| Family physicians | 6,809 | 1.5% | 104 | 2.2% |
| Neurologists | 2,494 | 1.4% | 35 | 1.8% |
| Home builders | 1,863 | 1.3% | 25 | 4.2% |
| Aerospace manufacturers | 1,802 | 1.3% | 24 | 3.0% |
| Radiologists | 4,051 | 1.1% | 45 | 1.4% |
| ENT doctors | 3,906 | 1.0% | 40 | 1.5% |
| Hotels | 12,276 | 0.8% | 96 | 1.0% |
| Golf courses | 1,153 | 0.7% | 8 | 1.1% |
| Orthopedic surgeons | 2,220 | 0.6% | 14 | 1.8% |
| Colleges | 4,516 | 0.6% | 27 | 0.8% |
| Surgeons | 4,557 | 0.6% | 26 | 0.8% |
| Private equity firms | 1,126 | 0.5% | 6 | 1.9% |
| Cardiologists | 3,523 | 0.5% | 17 | 0.8% |
| Hospitals | 5,171 | 0.4% | 22 | 0.5% |
| Banks | 4,697 | 0.4% | 19 | 0.5% |
| Urologists | 5,431 | 0.4% | 20 | 0.6% |
| Oil and gas companies | 3,180 | 0.3% | 10 | 0.7% |
| Anesthesiologists | 3,998 | 0.3% | 12 | 0.5% |
| Pathologists | 1,496 | 0.3% | 4 | 0.3% |
| Churches | 26,901 | 0.2% | 59 | 0.9% |
Method: we read the about-section attributes on every listing in our 435 ready-made lists, once per business per list, for businesses in the delivered files only. More on the insights hub, including wheelchair accessible businesses and payment methods.